Evaluation Metrics for Object Detection
Precision & Recall
Confusion matrix:
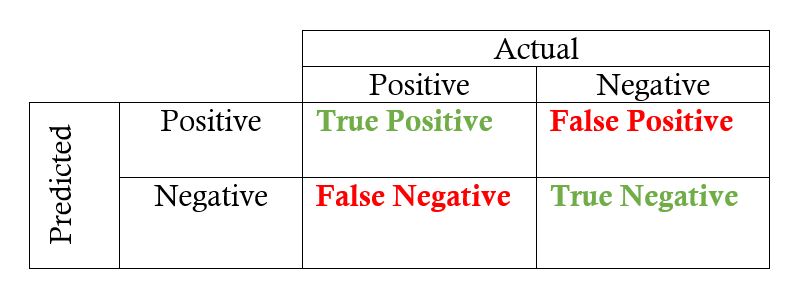
Precision: measures how accurate is your predictions. i.e. the percentage of your predictions are correct. $$ \text{precision} = \frac{TP}{TP + FP} $$
Recall: measures how good you find all the positives. $$ \text{recall} = \frac{TP}{TP + FN} $$
More see: Evaluation
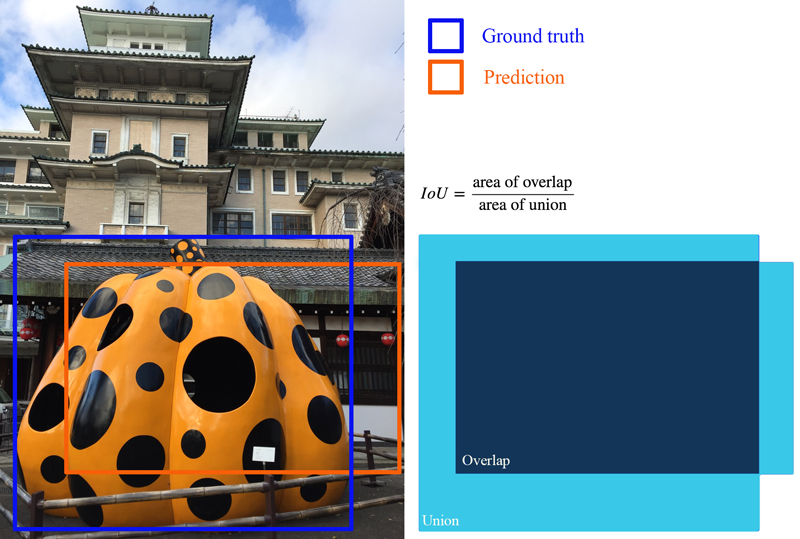
IoU (Intersection over union)
IoU measures the overlap between 2 boundaries.
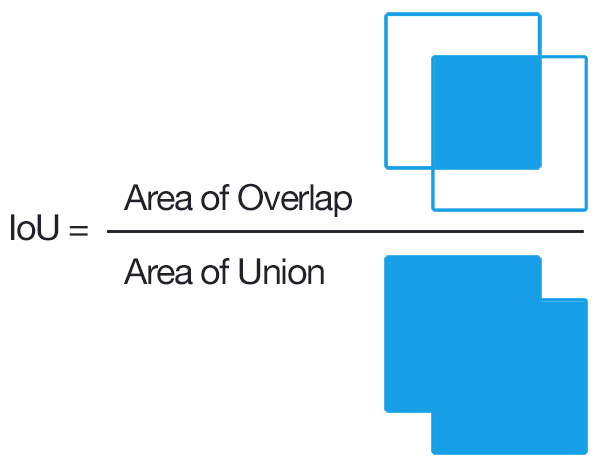
We use that to measure how much our predicted boundary overlaps with the ground truth (the real object boundary).
AP (Average Precision)
Let’s create an over-simplified example in demonstrating the calculation of the average precision. In this example, the whole dataset contains 5 apples only.
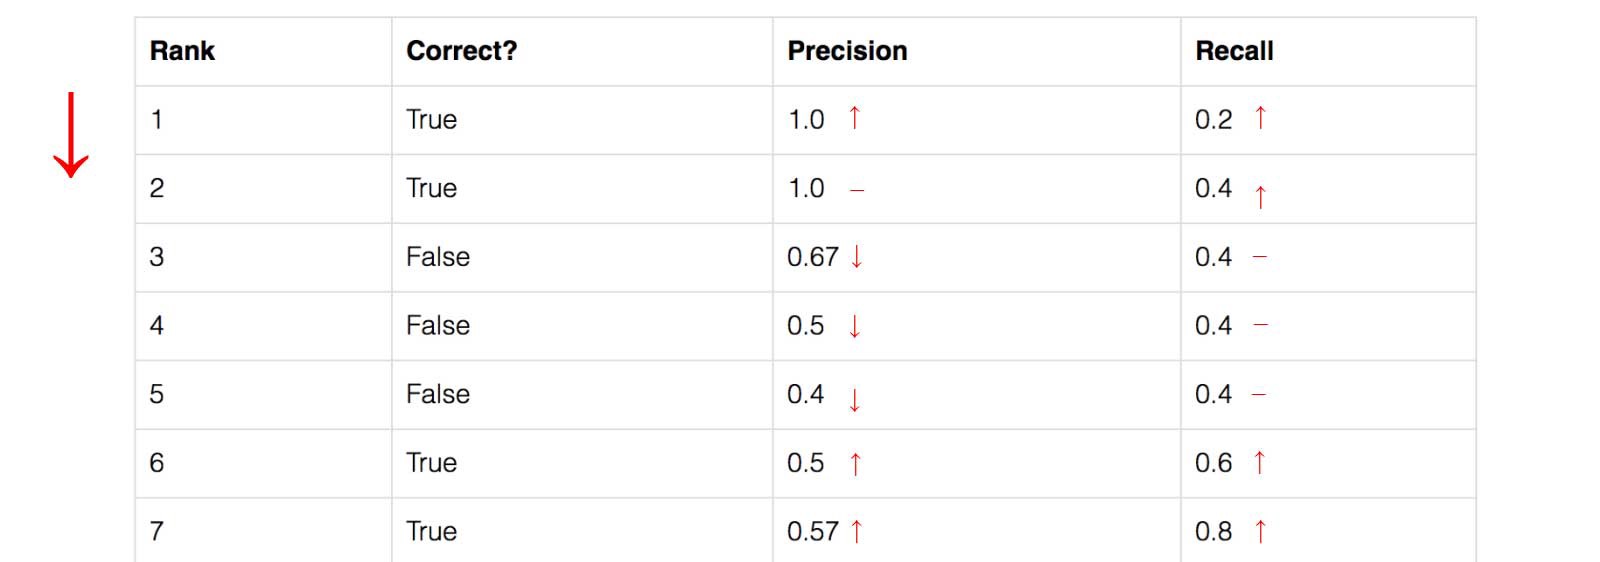
We collect all the predictions made for apples in all the images and rank it in descending order according to the predicted confidence level. The second column indicates whether the prediction is correct or not. In this example, the prediction is correct if IoU ≥ 0.5.
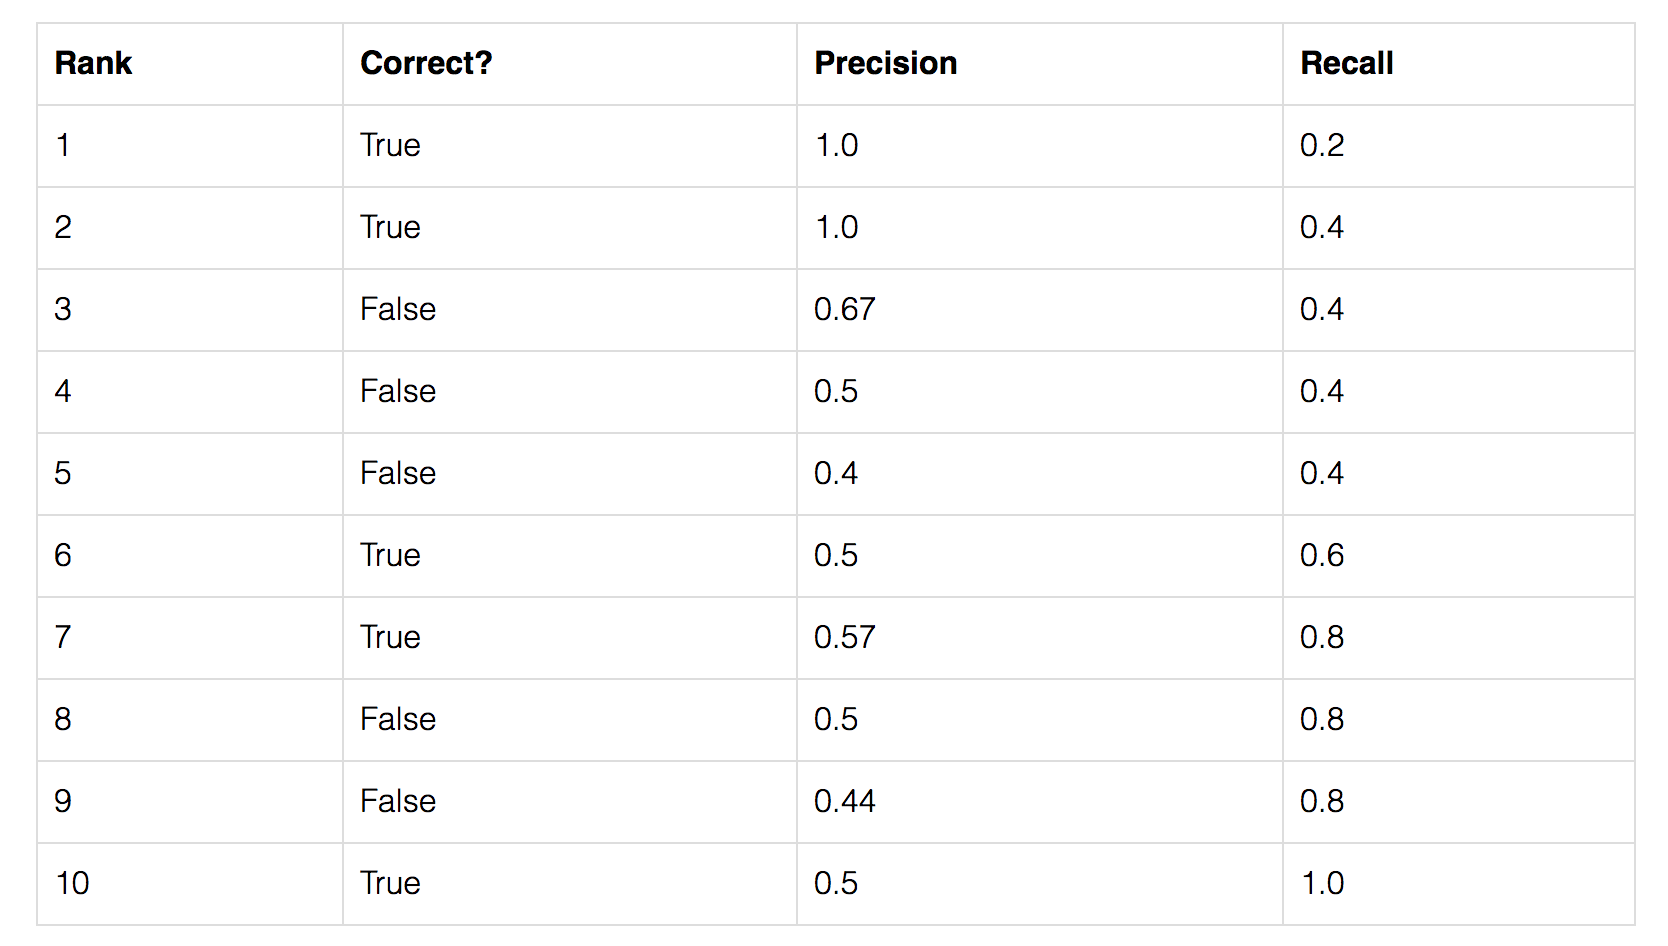
Let’s look at the 3rd row:
- Precision: proportion of TP (= 2/3 = 0.67)
- Recall: proportion of TP out of the possible positives (= 2/5 = 0.4)
Recall values increase as we go down the prediction ranking. However, precision has a zigzag pattern — it goes down with false positives and goes up again with true positives.
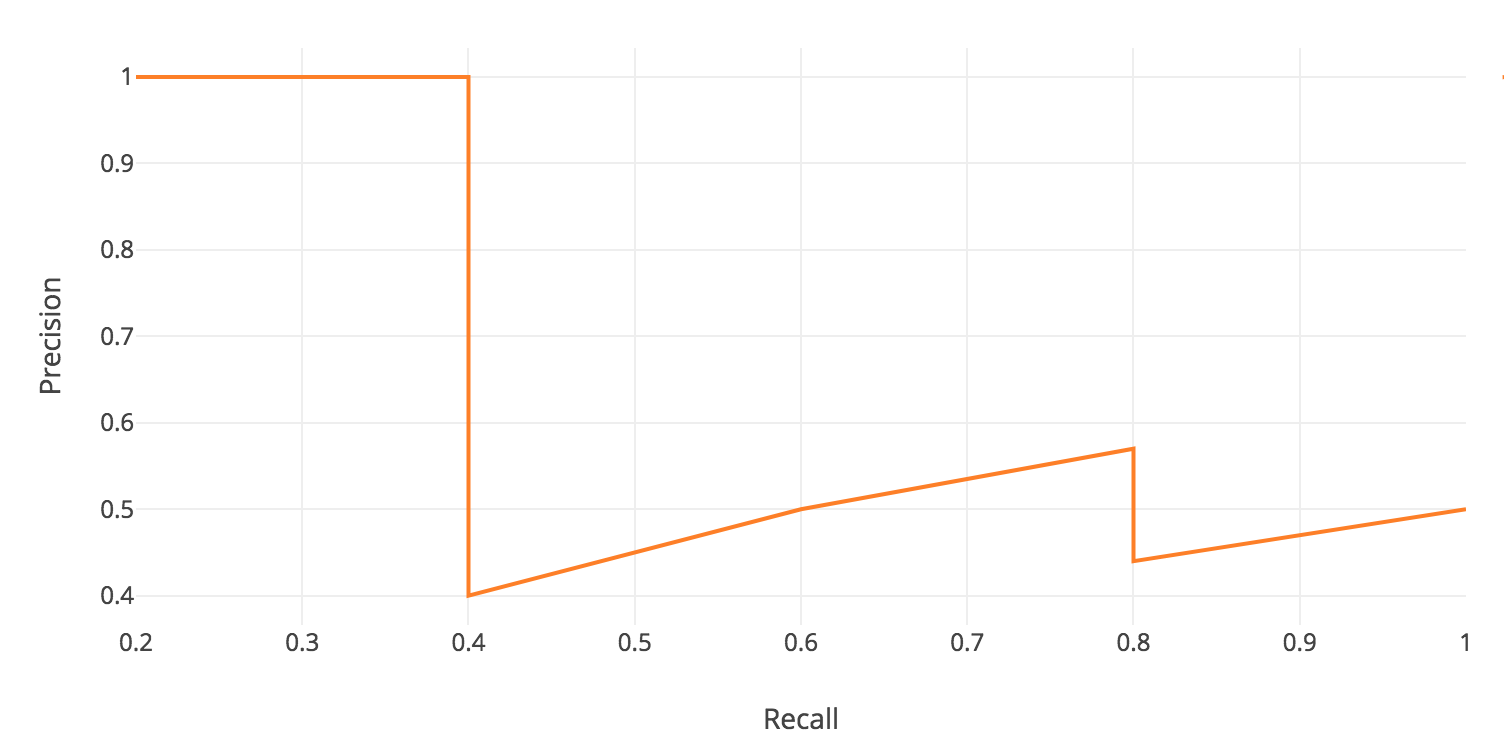
The general definition for the Average Precision (AP) is finding the area under the precision-recall curve above. $$ \mathrm{AP}=\int_{0}^{1} p(r) d r $$
Smoothing the Precision-Recall-Curve
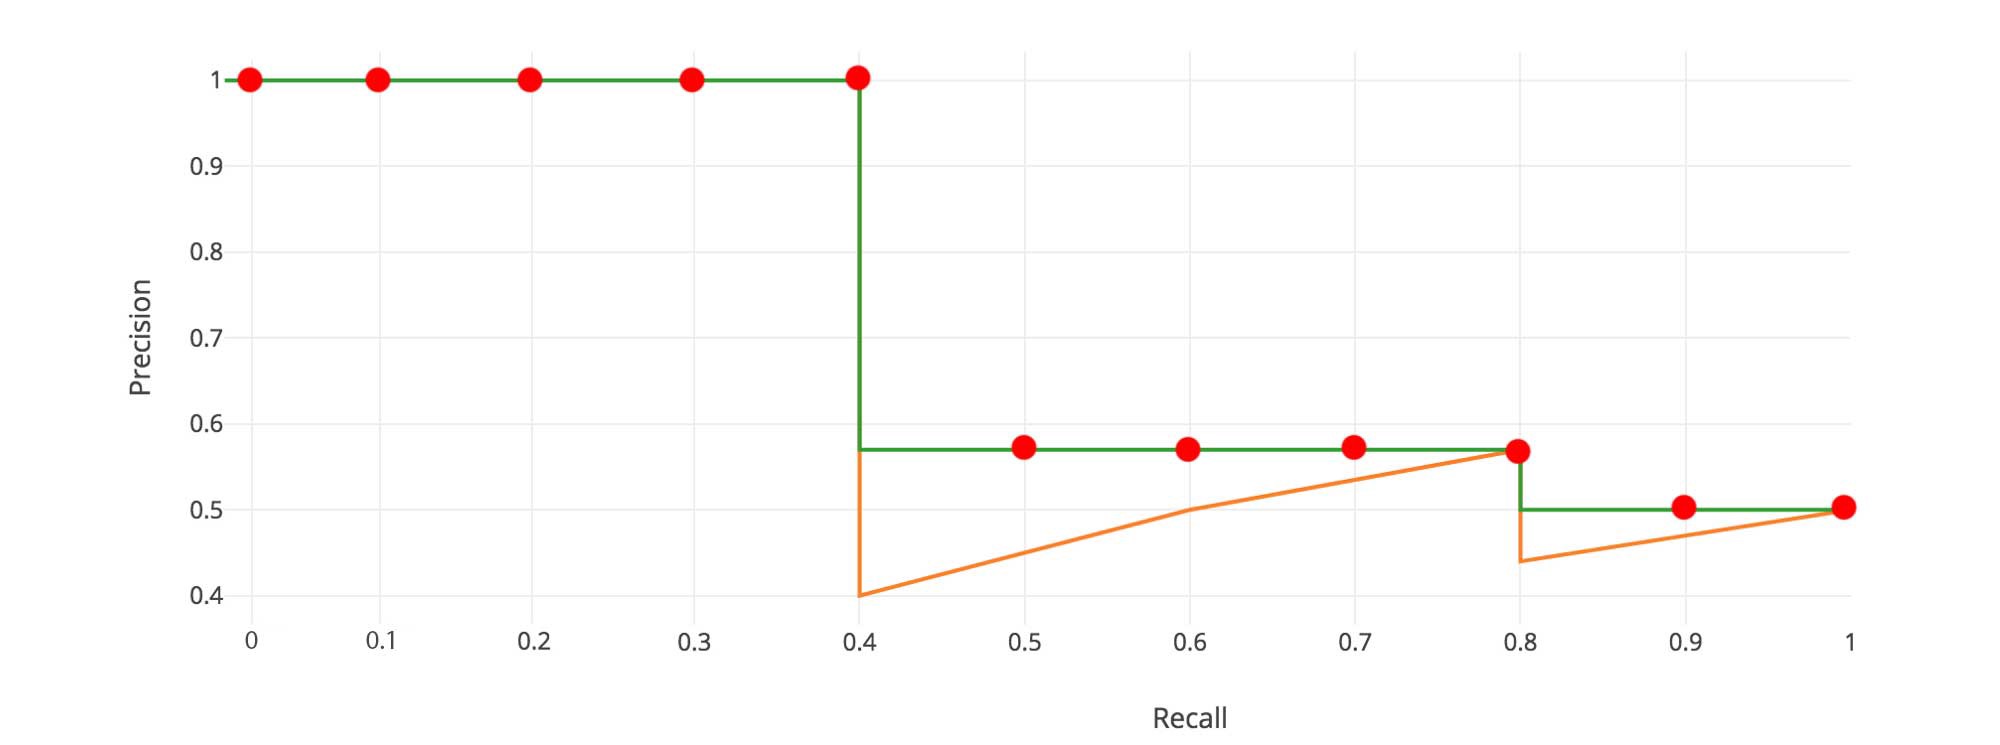
Before calculating AP for the object detection, we often smooth out the zigzag pattern first: at each recall level, we replace each precision value with the maximum precision value to the right of that recall level.
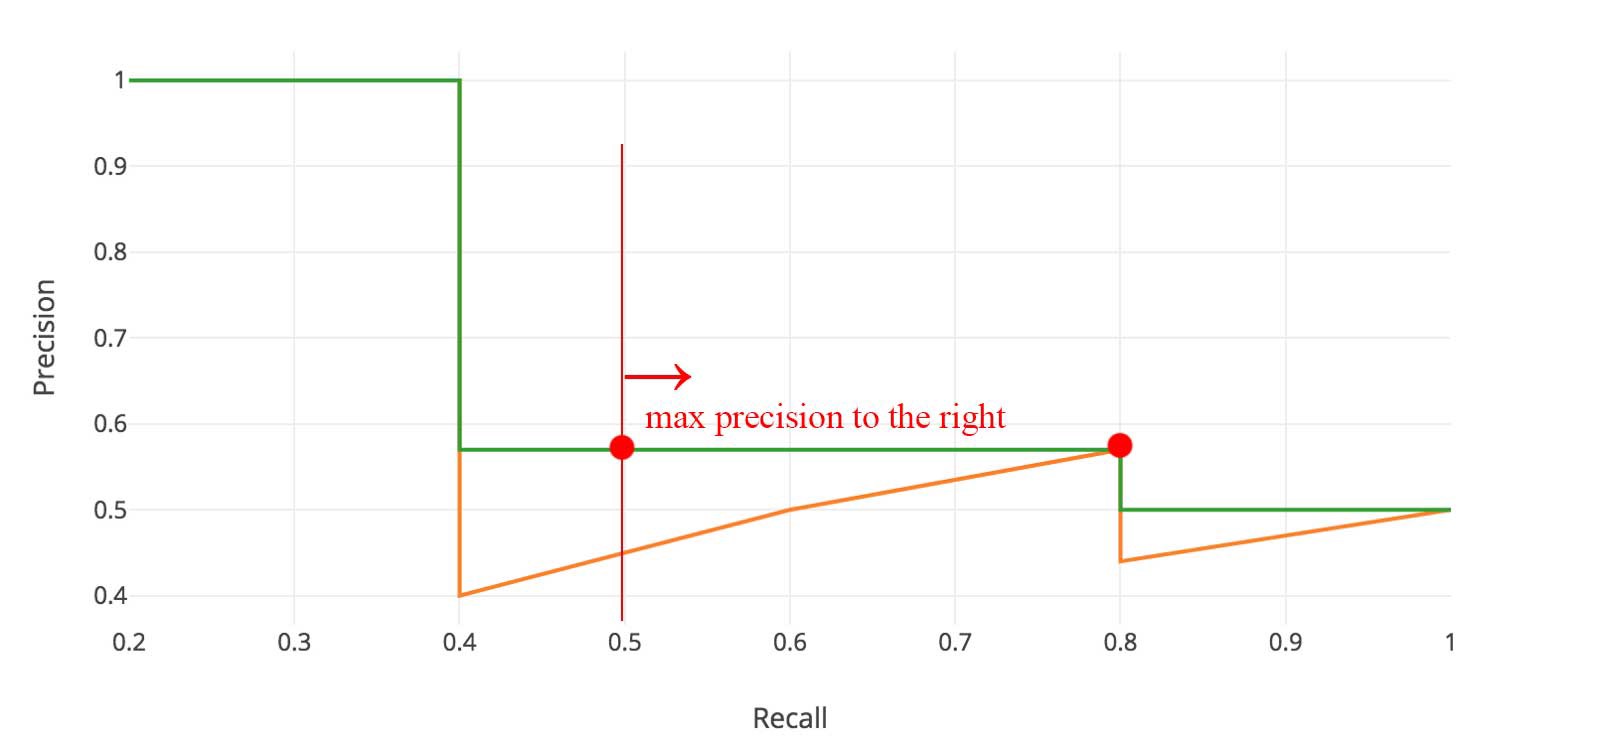
The orange line is transformed into the green lines and the curve will decrease monotonically instead of the zigzag pattern.
| Before smoothing | After smoothing |
|---|---|
| 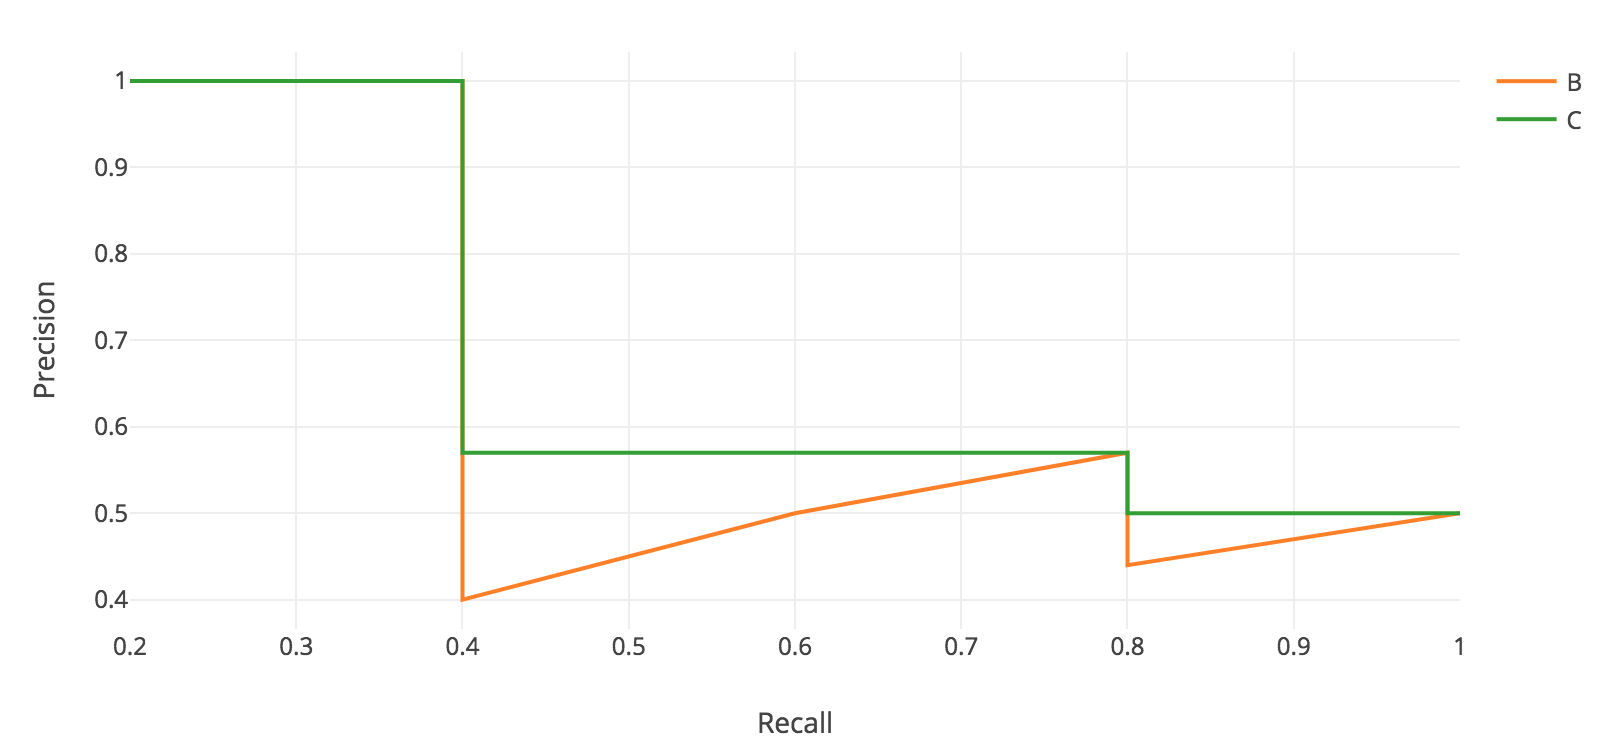 |
Mathematically, we replace the precision value for recall $\tilde{r}$ with the maximum precision for any recall $\geq \tilde{r}$. $$ p_{\text {interp}}(r)=\max_{\tilde{r} \geq r} p(\tilde{r}) $$
Interpolated AP
PASCAL VOC is a popular dataset for object detection. In Pascal VOC2008, an average for the 11-point interpolated AP is calculated.
Divide the recall value from 0 to 1.0 into 11 points — 0, 0.1, 0.2, …, 0.9 and 1.0.
Compute the average of maximum precision value for these 11 recall values. $$ \begin{aligned} A P &=\frac{1}{11} \sum_{r \in\{0.0, \ldots, 1.0\}} A P_{r} \\ &=\frac{1}{11} \sum_{r \in\{0.0, \ldots, 1.0\}} p_{\text {interp}}(r) \end{aligned} $$
In our example:
$AP = \frac{1}{11} \times (5 \times 1.0 + 4 \times 0.57 + 2 \times 0.5)$
However, this interpolated method is an approximation which suffers two issues.
- It is less precise.
- It lost the capability in measuring the difference for methods with low AP.
Therefore, a different AP calculation is adopted after 2008 for PASCAL VOC.
AP (Area under curve AUC)
For later Pascal VOC competitions, VOC2010–2012 samples the curve at all unique recall values (r₁, r₂, …), whenever the maximum precision value drops. With this change, we are measuring the exact area under the precision-recall curve after the zigzags are removed.
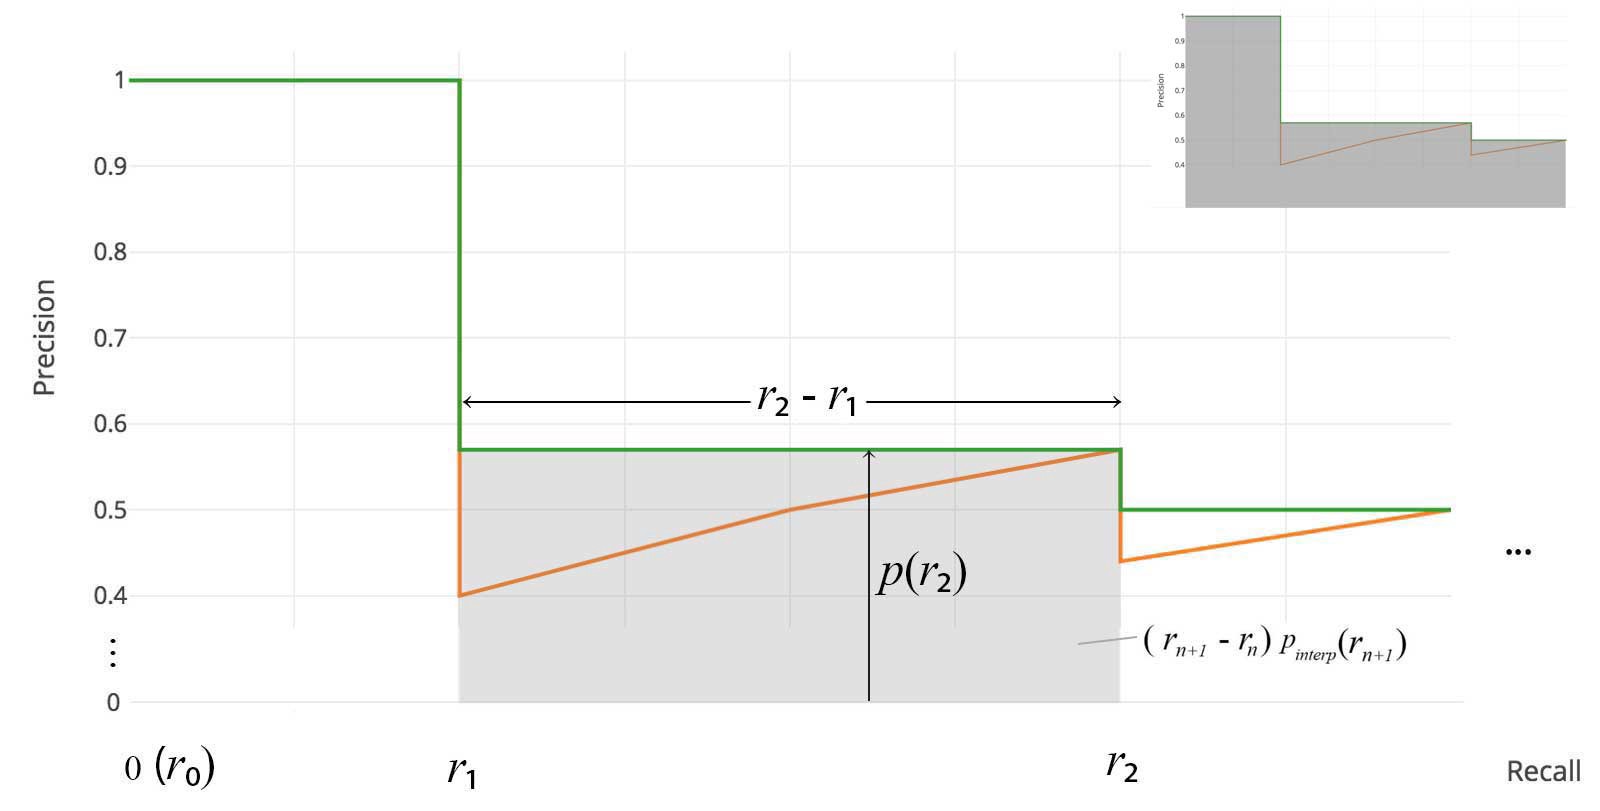
No approximation or interpolation is needed 👏. Instead of sampling 11 points, we sample $p(r_i)$ whenever it drops and computes AP as the sum of the rectangular blocks. $$ \begin{array}{l} p_{\text {interp}}\left(r_{n+1}\right)=\displaystyle{\max_{\tilde{r} \geq r_{n+1}}} p(\tilde{r}) \\ \mathrm{AP}=\sum\left(r_{n+1}-r_{n}\right) p_{\text {interp}}\left(r_{n+1}\right) \end{array} $$ This definition is called the Area Under Curve (AUC).