You Only Look Once (YOLO)
The problem of sliding windows method is that it does not output the most accuracte bounding boxes. A good way to get this output more accurate bounding boxes is with the YOLO (You Only Look Once) algorithm.
Overview: How does YOLO work?
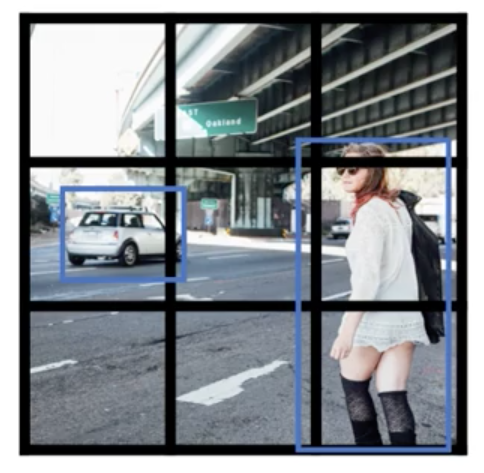
Let’s say we have an input image (e.g. at 100x100), we’re going to place down a grid on this image. For the purpose of simplicity and illustration, we’re going to use a 3x3 grid as example.
(In an actual implementation, we’ll use a finer one, like 19x19 grid)
Labels for training
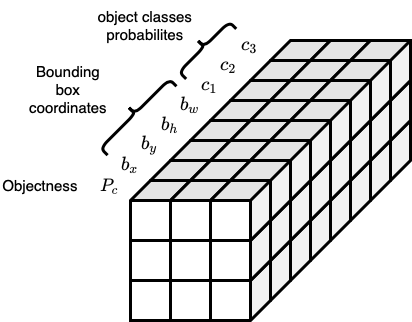
For each grid cell, we specify a target label $\mathbf{y}$: $$ \mathbf{y} = \left( \begin{array}{c} P_c \\ b_x \\ b_y \\ b_h \\ b_w \\ c_1 \\ c_2 \\ \vdots \\ c_n \end{array} \right) \in \mathbb{R}^{5 + n} $$
$P_c$: objectness
- depends on whether there’s an object in that grid cell.
- If yes, then $P_c = 1$. else $P_c=0$
Bounding box coordinates
- $b_x, b_y \in (0, 1)$: describe the center point of the object relative to the grid cell
- If $>1$, then the center point is outside of the current grid cell and it should be assigned to another grid cell
- Some parameterizations also use Sigmoid function to ensure $b_x, b_y \in (0, 1)$
- $b_h, b_w$: height and width of the bounding box,
- specified as a fraction of the overall width of the grid cell (can be $\geq 1$)
- Some parameterizations also use exponential function to ensure non-negativity
- $b_x, b_y \in (0, 1)$: describe the center point of the object relative to the grid cell
$c_1, c_2, \dots, c_n$: object classes probabilities we want to detect
E.g. we want to detect 3 classes of object:
- pedestrian ($c_1$),
- car ($c_2$),
- motorcycle ($c_3$),
so our target $\mathbf{y}$ will be: $$ \mathbf{y} = \left( \begin{array}{c} P_c \\ b_x \\ b_y \\ b_h \\ b_w \\ c_1 \\ c_2 \\ c_3 \end{array} \right) \in \mathbb{R}^{8} $$
Example
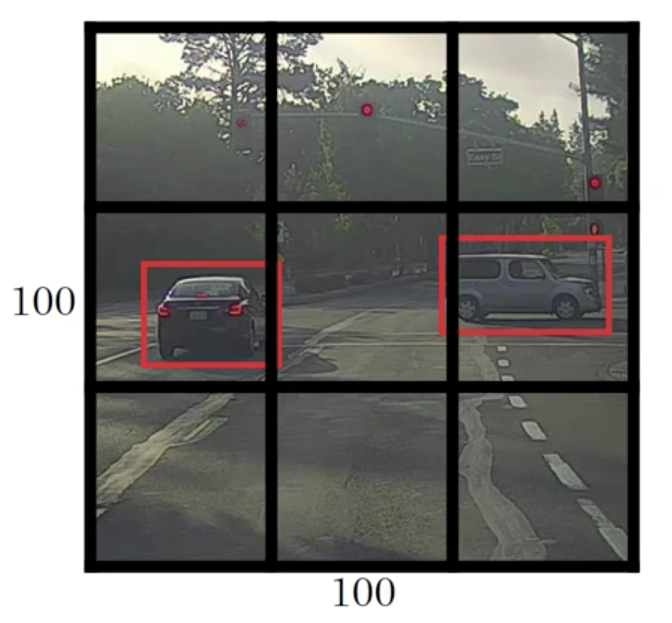
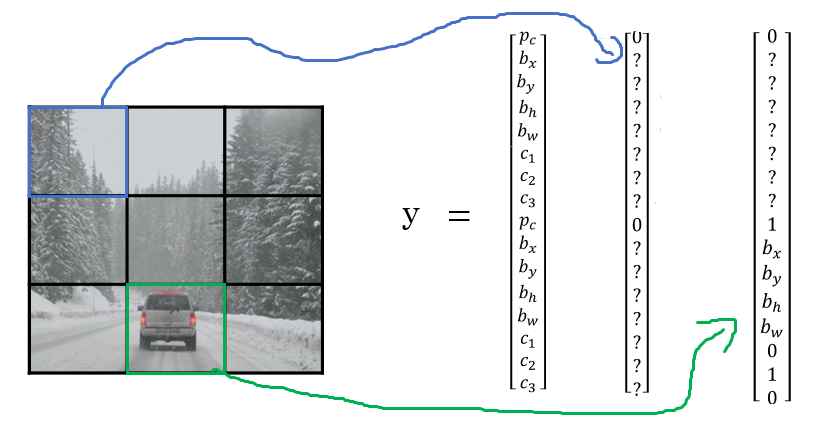
If we consider the upper left grid cell (at position $(0, 0)$)
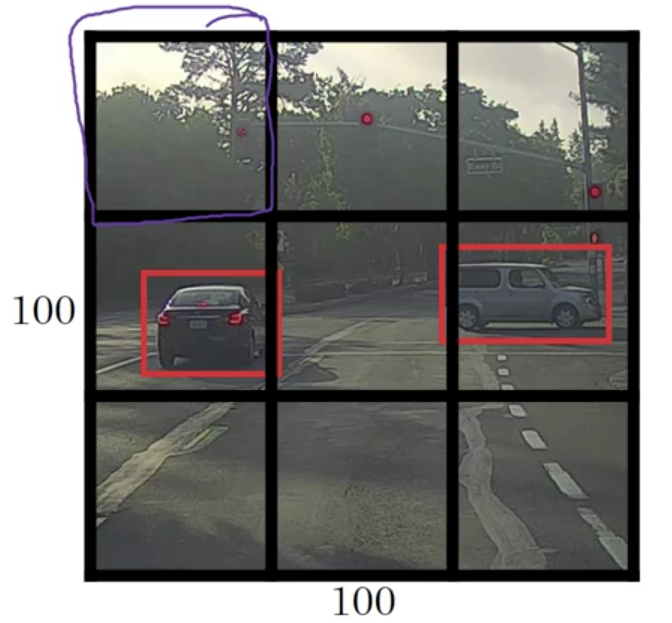
There’s no object in this grid cell, so $P_c = 0$, and we don’t have to care for the rest elements of $\mathbf{y}$: $$ \mathbf{y} = \left( \begin{array}{c} 0 \\ ? \\ ? \\ ? \\ ? \\ ? \\ ? \\ ? \end{array} \right) \in \mathbb{R}^{8} $$
Here we use the symbol
? to mark “don’t care”.However, neural network can’t output a question mark, can’t output a “don’t care”. So wes’ll put some numbers for the rest. But these numbers will basically be ignored because the neural network is telling you that there’s no object there. So it doesn’t really matter whether the output is a bounding box or there’s is a car. So basically just be some set of numbers, more or less noise.
Now, how about the grid cells in the second row?
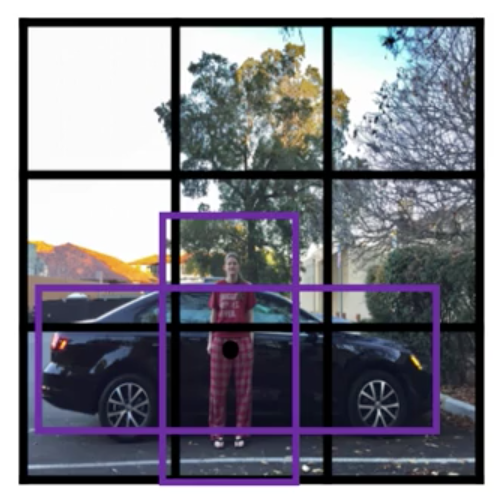
To give a bit more detail, this image has two objects. And what the YOLO algorithm does is
it takes the midpoint of reach of the two objects and then assigns the object to the grid cell containing the midpoint. So the left car is assigned to the left grid cell marked with green; and the car on the rightis assigned to the grid cell marked with yellow.
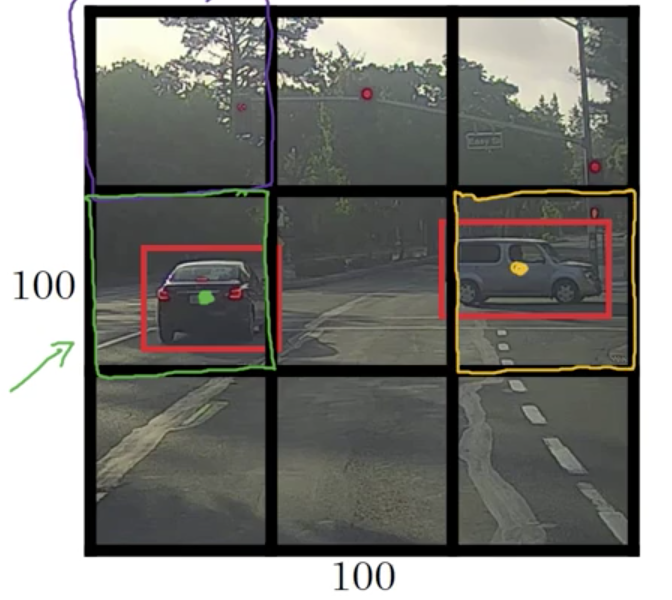
- For the left grid cell marked with green, the target label $\mathbf{y}$ would be as follows: $$ \mathbf{y} = \left( \begin{array}{c} 1 \\ b_x \\ b_y \\ b_h \\ b_w \\ 0 \\ 1 \\ 0 \end{array} \right) $$
Even though the central grid cell has some parts of both cars, we’ll pretend the central grid cell has no interesting object. So the class label of the central grid cell is $$ \mathbf{y} = \left( \begin{array}{c} 0 \\ ? \\ ? \\ ? \\ ? \\ ? \\ ? \\ ? \end{array} \right) $$
For each of these 9 grid cells, we end up with a 8 dimensional output vector. So the total target output volume is $(3 \times 3) \times 8$.
Generally speaking, assuming that we have $n \times n$ grid cells, and we want to detect $C$ classes of objects, then the target output volume will be $(n \times n) \times (5 + C)$.
Training
To train our neural network, the input is $100 \times 100 \times 3$. And then we have a usual convnet with conv, layers of max pool layers, and so on. So that in the end, this eventually maps to a $3 \times 3 \times 8$ output volume. And so what we do is we have an input $X$ which is the input image like that, and we have these target labels $\mathbf{y}$ which are $3 \times 3 \times 8$, and we use backpropagation to train the neural network to map from any input $X$ to this type of output volume $\mathbf{y}$.
👍 Advantages
The neural network outputs precise bounding boxes 👏
Effeicient and fast thanks to convolution operations 👏
Intersection over Union (IoU)
How can we tell whether our object detection algorithm is working well?
The Intersection-over-Union (IoU), aka Jaccard Index or Jaccard Overlap, measure the degree or extent to which two boxes overlap.
](https://raw.githubusercontent.com/EckoTan0804/upic-repo/master/uPic/IoU.jpg)
In object detection: $$ \text{IoU} = \frac{\text{Overlapping region between ground truth and prediction bounding box}}{\text{Combined region of ground truth and prediction bounding box}} $$ If $\text{IoU} \geq \text{threshold}$, we would say the prediction is correct.
By convention, $\text{threshold} = 0.5$. We can also chosse other value greater than 0.5.
Example:
](https://media5.datahacker.rs/2018/11/IoU.png)
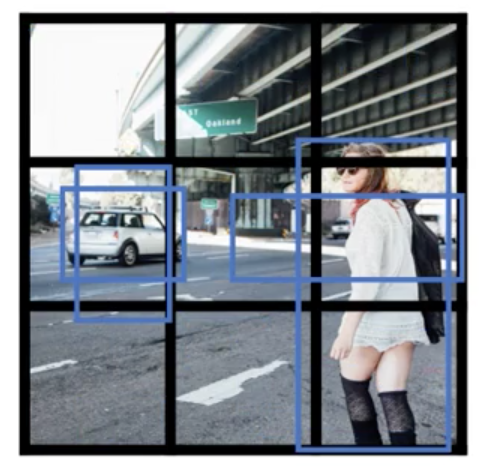
Non-max suppresion
One of the problems we have addressed in YOLO is that it can detect the same object multiple times.
For example:
](https://raw.githubusercontent.com/EckoTan0804/upic-repo/master/uPic/non-max-suppression.png)
Non-max Suppression is a way to make sure that YOLO detects the object just once. It cleans up redundant detections. So they end up with just one detection per object, rather than multiple detections per object.
- Takes the detection with the largest $P_c$ (the probability of a detection) (“That’s my most confident detection, so let’s highlight that and just say I found the car there.”)
- Looks at all of the remaining rectangles and all the ones with a high overlap (i.e. with a high IOU), just suppress/darken/discard them
Example:
](https://www.jeremyjordan.me/content/images/2018/07/Screen-Shot-2018-07-10-at-9.46.29-PM.png)
For multi-class detection, non-max suppression should be carried out on each class separately.
Anchor box
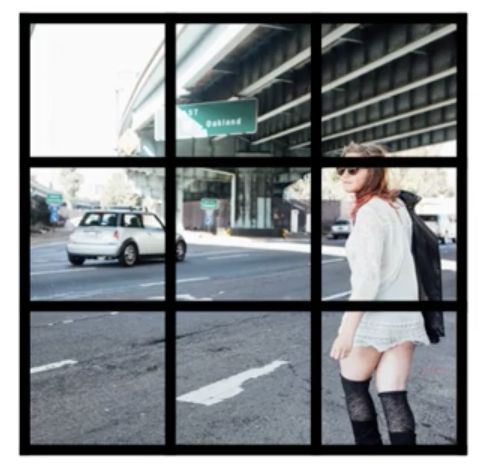
One of the problems with object detection as we have seen it so far is that each of the grid cells can detect only one object. What if a grid cell wants to detect multiple objects?
For example: we want to detect 3 classes (pedestrians, cars, motorcycles), and our input image looks like this:
The midpoint of the pedestrian and the midpoint of the car are in almost the same place and both of them fall into the same grid cell. If the output vector $$ \mathbf{y} = \left( \begin{array}{c} P_c \\ b_x \\ b_y \\ b_h \\ b_w \\ c_1 \\ c_2 \\ c_3 \end{array} \right) $$ we have seen before, it won’t be able to output two detections 😢.
With the idea of anchor boxes, we are going to
- pre-defne a number of different shapes of anchor boxes (in this example, just 2)
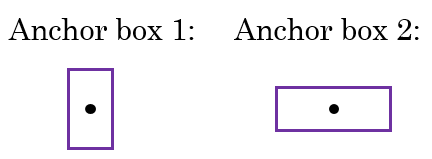
and associate them in the class labels $$ \mathbf{y} = \left(\underbrace{P_c, b_x, b_y, b_h, b_w, c_1, c_2, c_3}_{\text{anchor box 1}} , \underbrace{P_c, b_x, b_y, b_h, b_w, c_1, c_2, c_3}_{\text{anchor box 2}}\right)^T \in \mathbb{R}^{16} $$
- Because the shape of the pedestrian is more similar to the shape of anchor box 1 than anchor box 2, we can use the first eight numbers to encode pedestrian.
- Because the box around the car is more similar to the shape of anchor box 2 than anchor box 1, we can then use the second 8 numbers to encode that the second object here is the car
To summarise, with a number of pre-defined anchor boxes: Each object in training image is assigned to
- the grid cell that contains object’s midpoint and
- anchor box for the grid cell with the highest IoU with the ground truth bounding box
In other words, now the object is assigned to a $(\text{grid cell}, \text{anchor box})$ pair.
If
- we have pre-defined $B$ different size of bounding boxes
- the size of input image is $n \times n$
- we want to detect $C$ classes of objects
Then the output volume will be $$ (n \times n) \times B(5 + C) $$
How to choose the anchor boxes?
- People used to just choose them by hand or choose maybe 5 or 10 anchor box shapes that spans a variety of shapes that seems to cover the types of objects to detect
- A better way to do this is to use a K-means algorithm, to group together two types of objects shapes we tend to get. (in the later YOLO research paper)
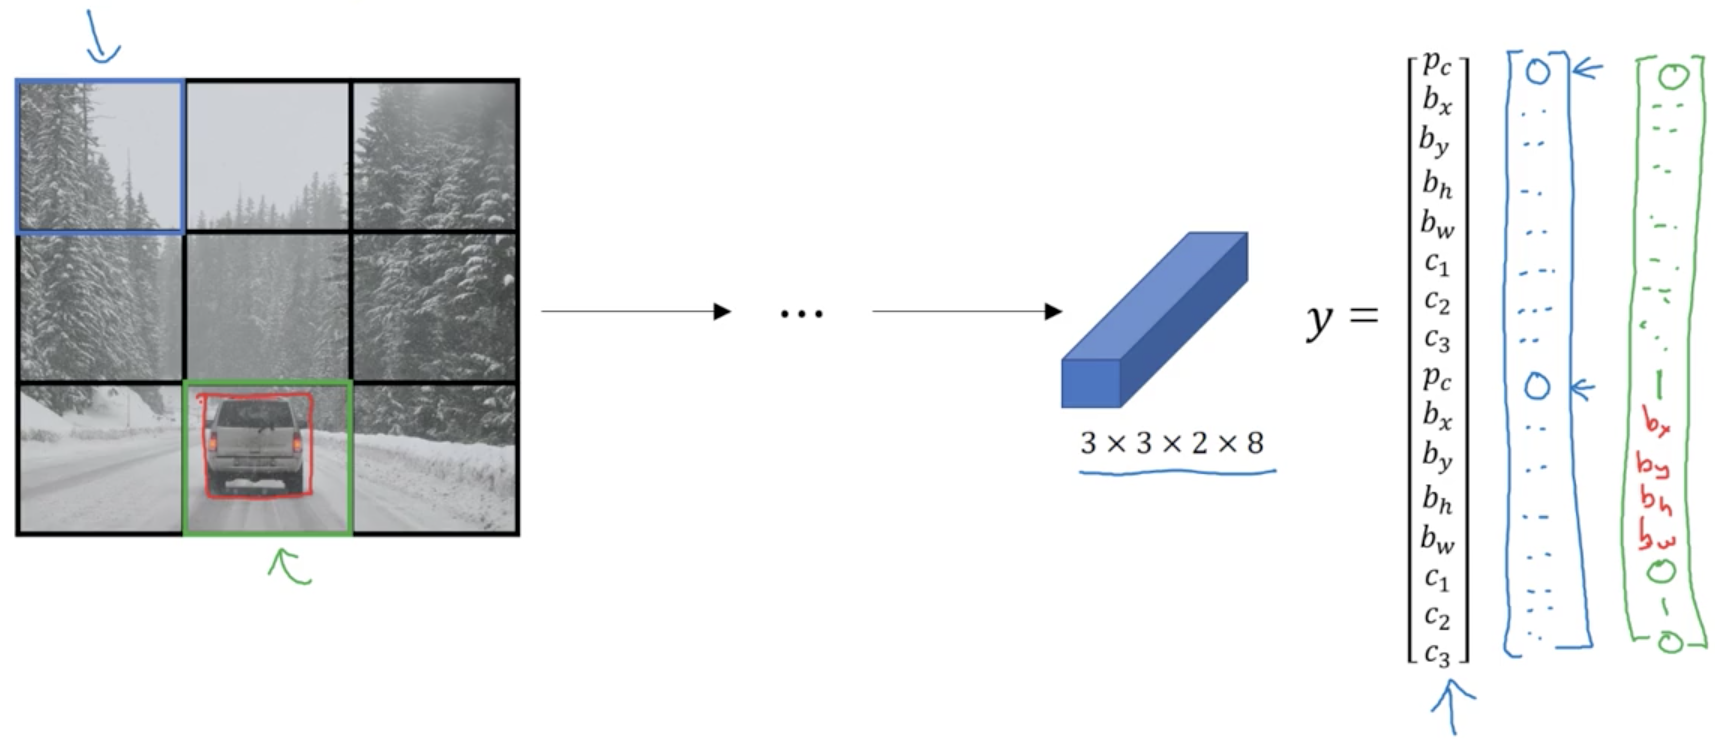
Putting them all together
Suppose we’re trying to train a model to detect three classes of objects:
- pedestrians
- cars
- motorcycles
And the input image looks like this:
Suppose we have pre-defined two different sizes of bounding boxes
Anchor box 2 has a higher IoU with the ground truth bounding box of the car, then:
The final output volume is $3 \times 3 \times 2 \times 8$
Making predictions
Outputing the non-max supressed outputs
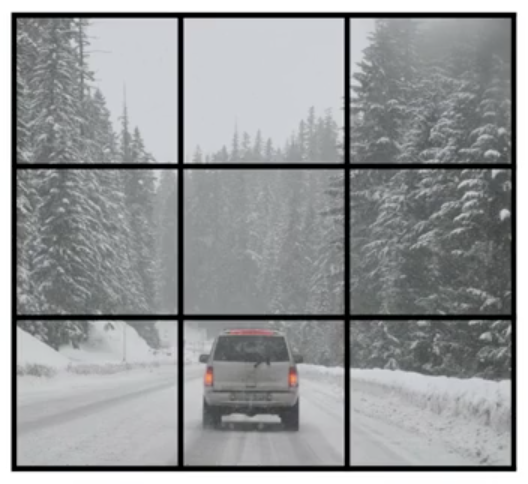
Let’s look at an new input image,
and suppose that we still use 2 pre-defined anthor boxes for detecting pedestrians, cars, and motorcycles.
For each grid cell, get 2 predicted bounding boxes. Notice that some of the bounding boxes can go outside the height and width of the grid cell that they came from
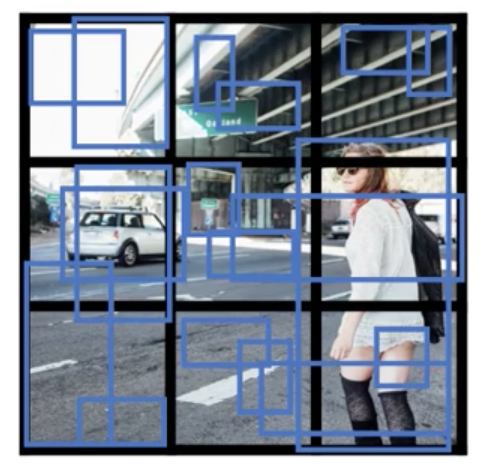
Get rid of low probability predictions
For each class, use non-max suppression to generate final predictions. And so the output of this is hopefully that we will have detected all the cars and all the pedestrians in this image.