Evaluation
TL;DR
Confusion matrix, ROC, and AUC
Confuse matrix
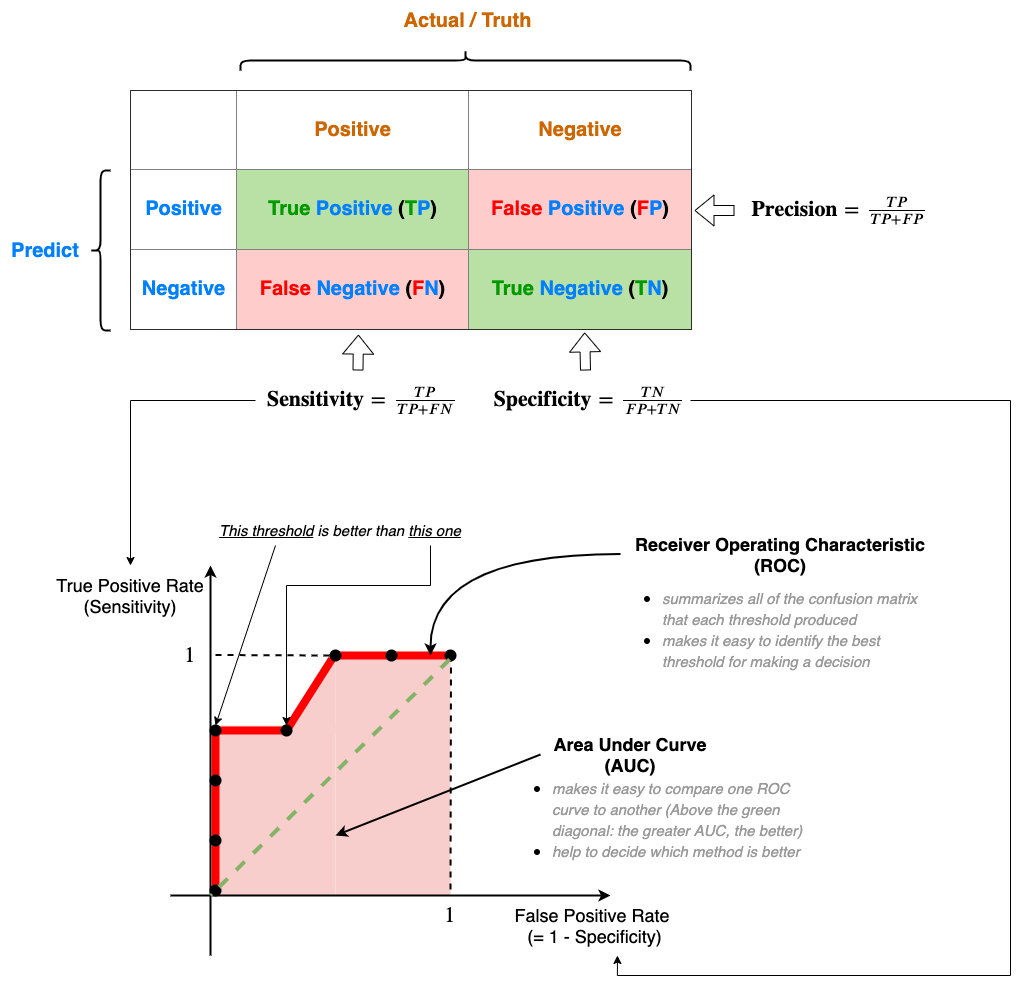
A confusion matrix tells you what your ML algorithm did right and what it did wrong.
| Known Truth | ||||
|---|---|---|---|---|
| Positive | Negative | |||
Prediction | Positive | True Positive (TP) | False Positive (FP) | Precision = TP / (TP+FP) |
| Negative | False Negative (FN) | True Negative (TN) | ||
| TPR = Sensitivity = Recall = TP / (TP + FN) | Specificity = TN / (FP+TN) FPR = FP / (FP + TN) = 1 - Specificity | |||
- Row: Prediction
- Column: Known truth
Each cell:
Positive/negative: refers to the prediction
True/False: Whether this prediction matches to the truth
The numbers along the diagonal (green) tell us how many times the samples were correctly classified
The numbers not on the diagonal (red) are samples the algorithm messed up.
Definition
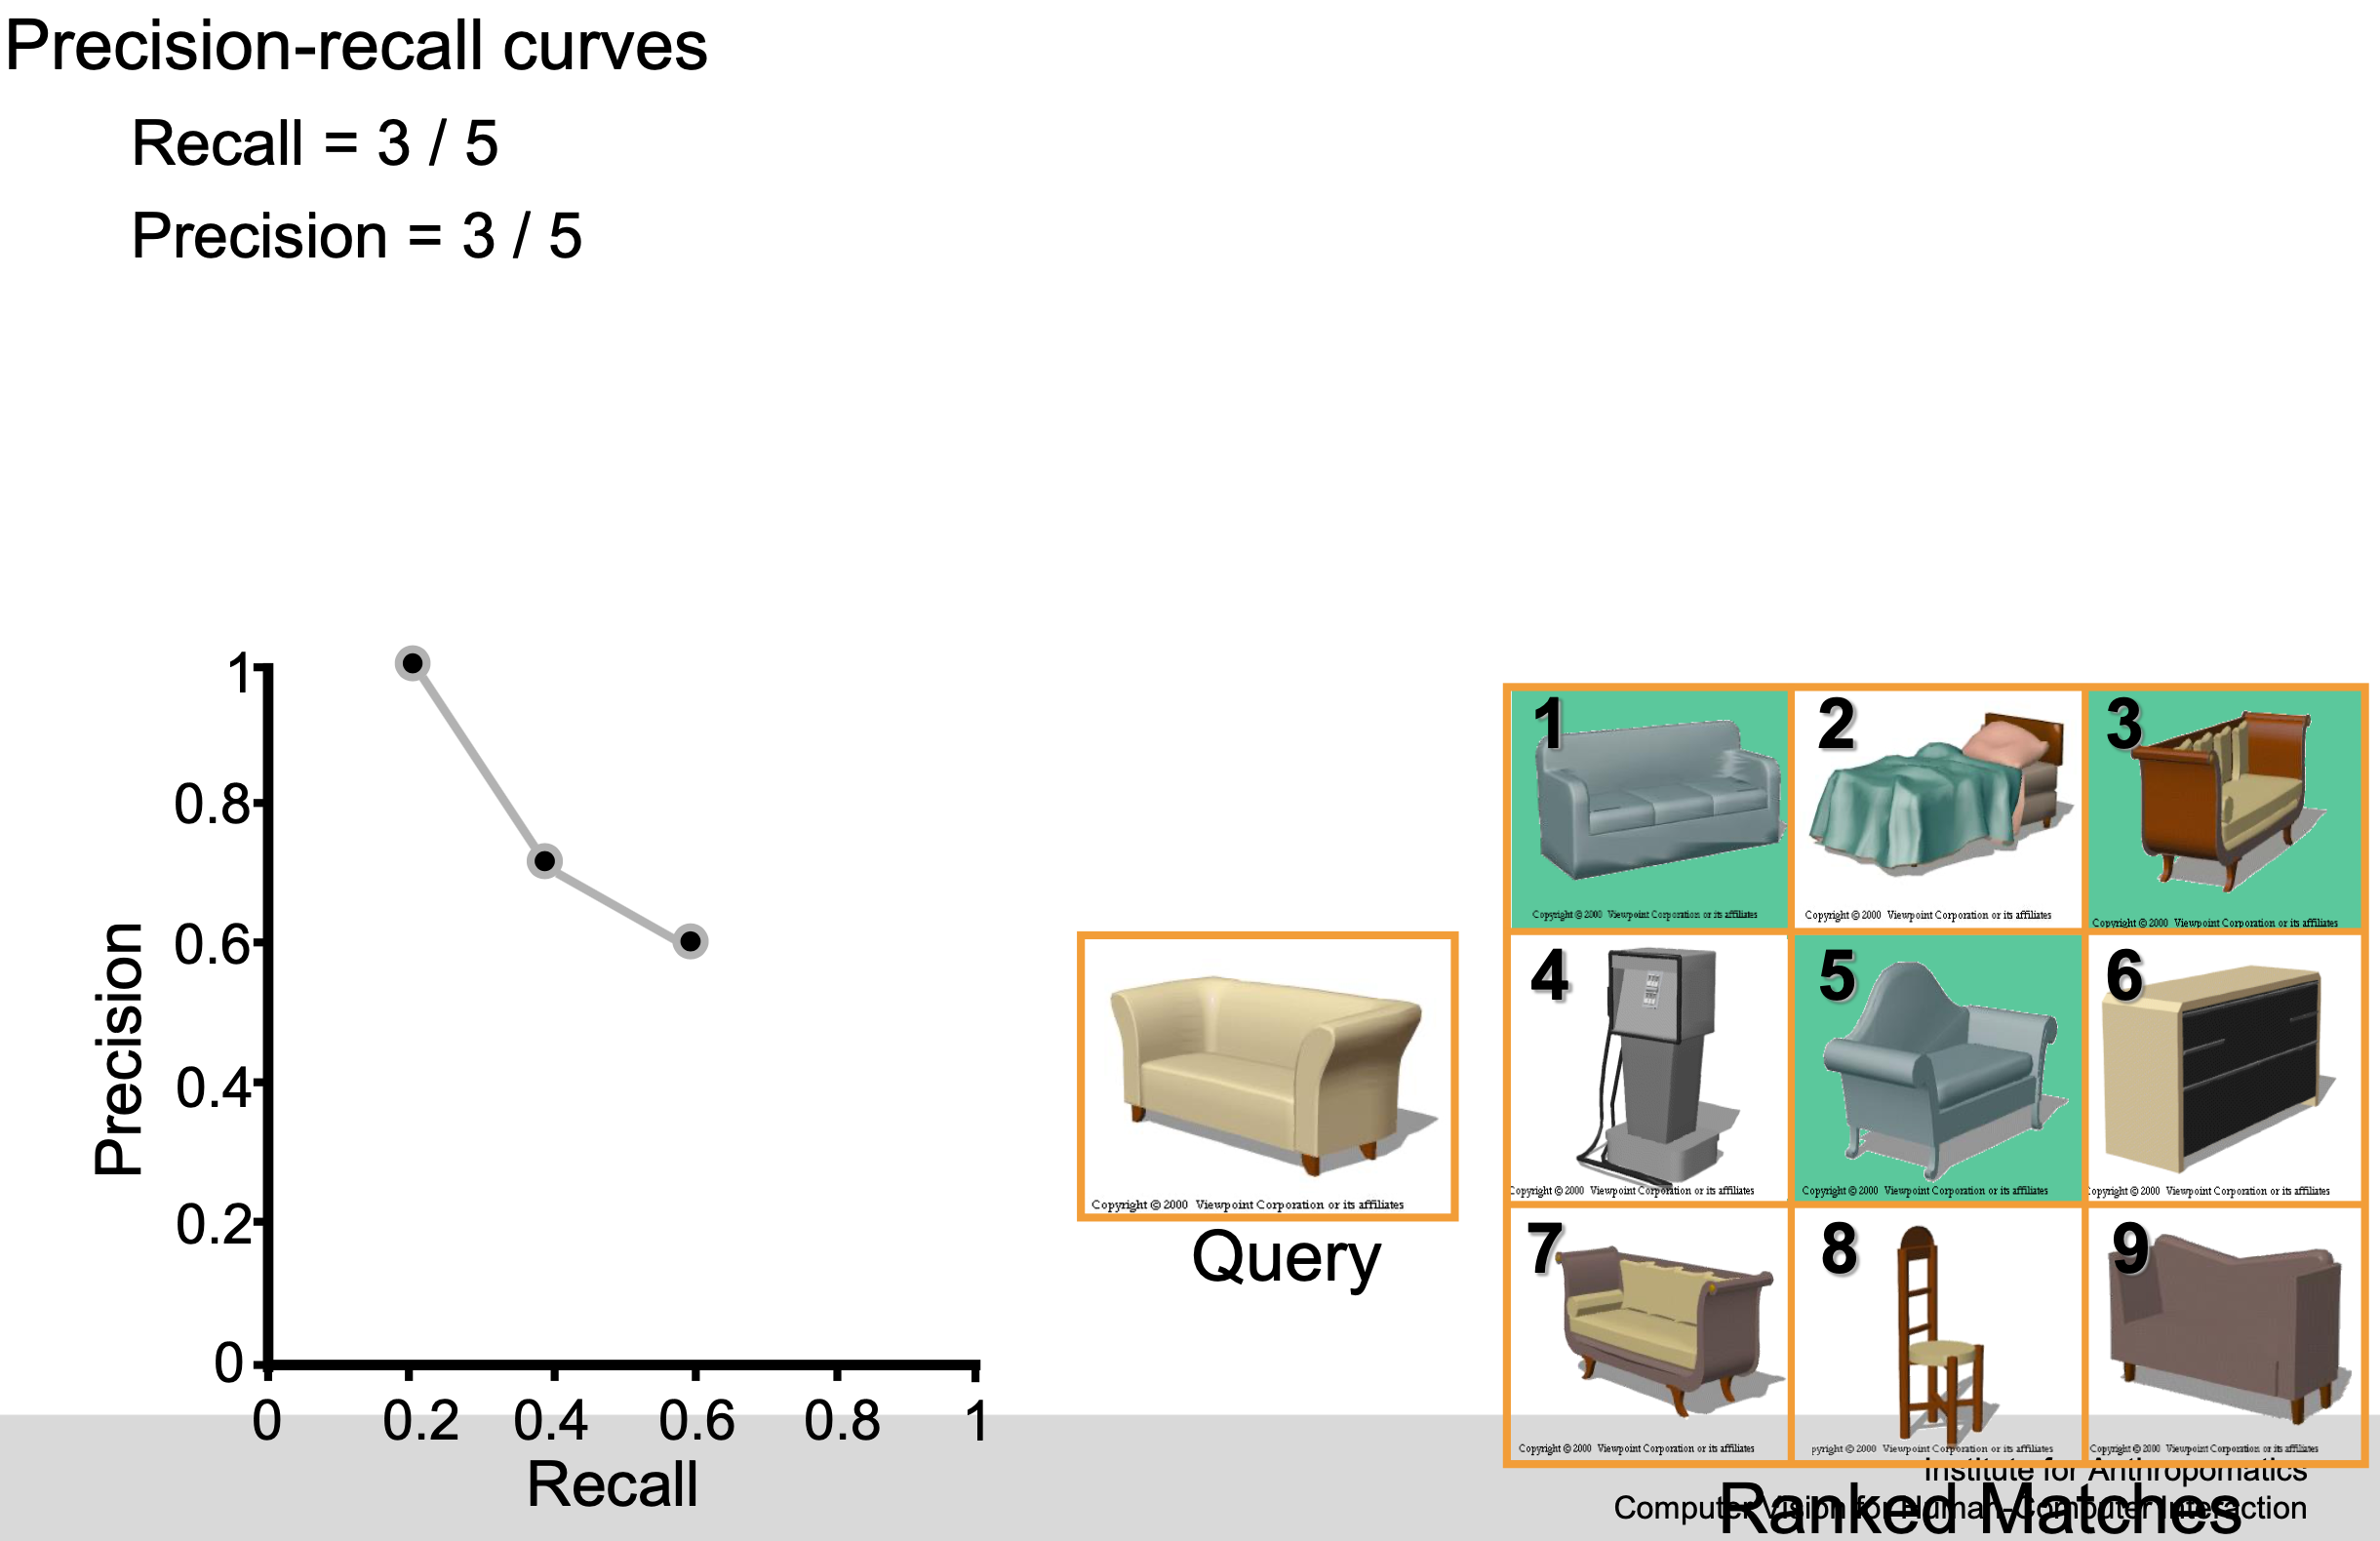
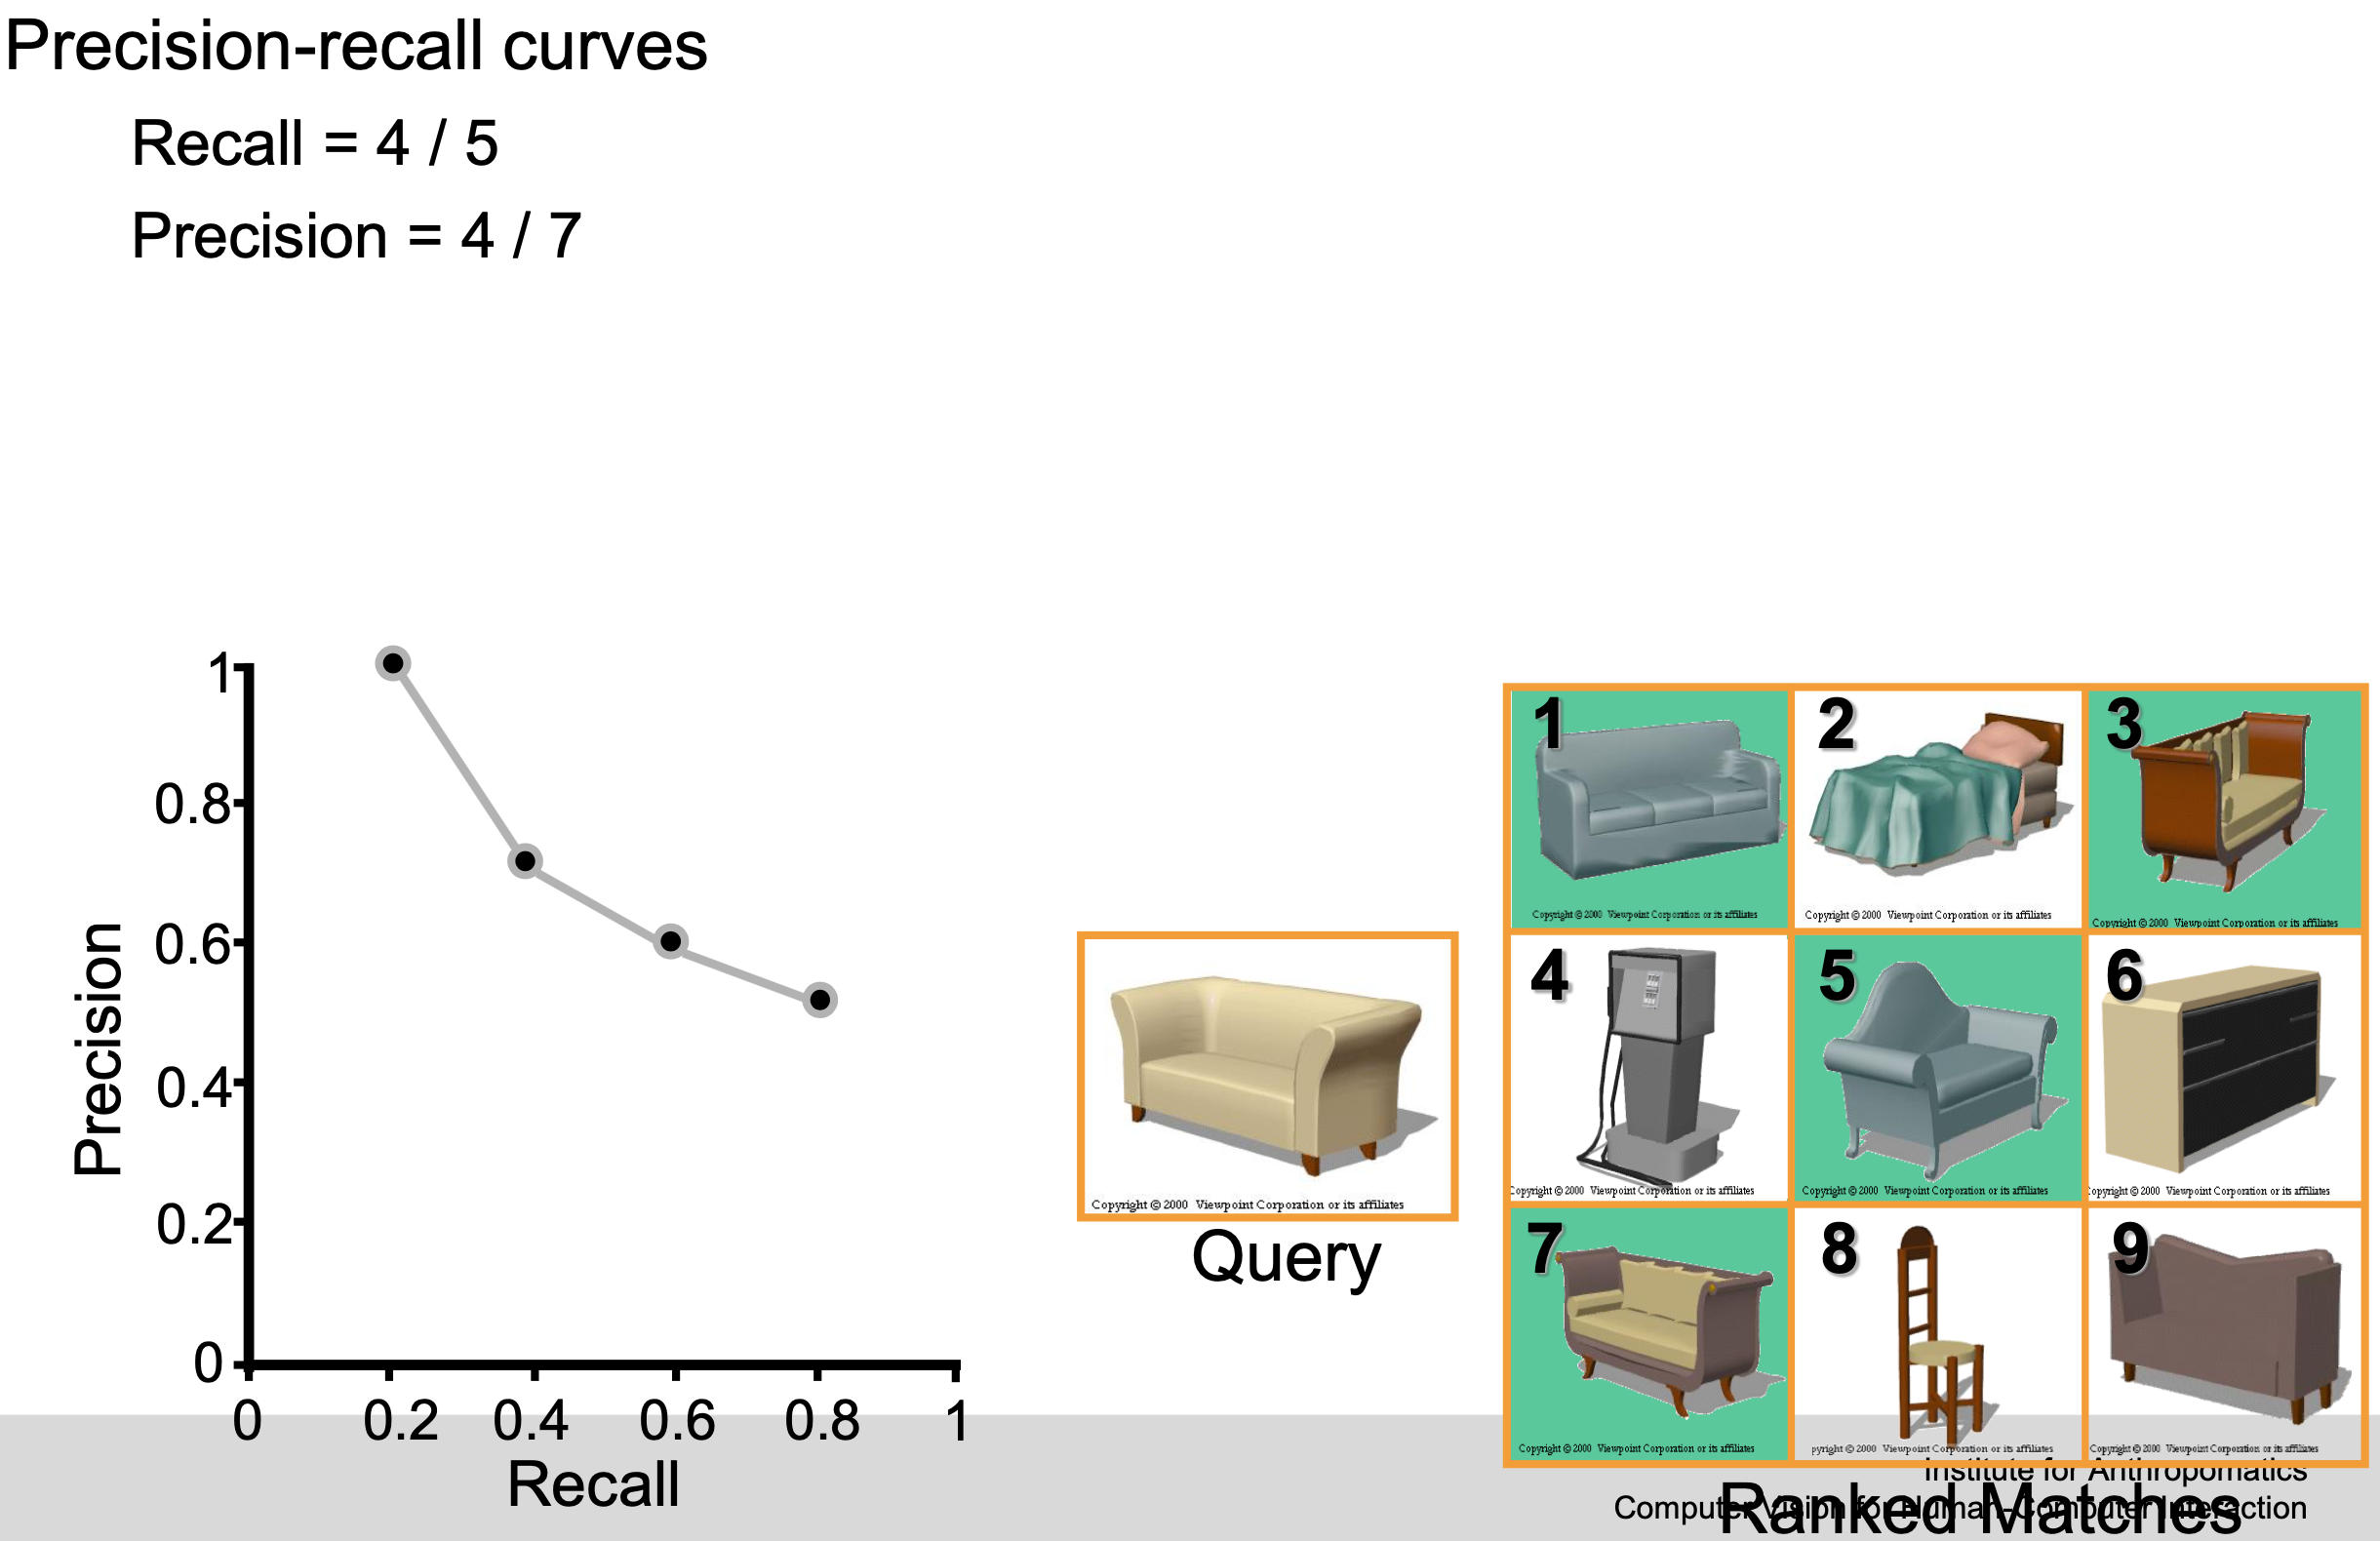
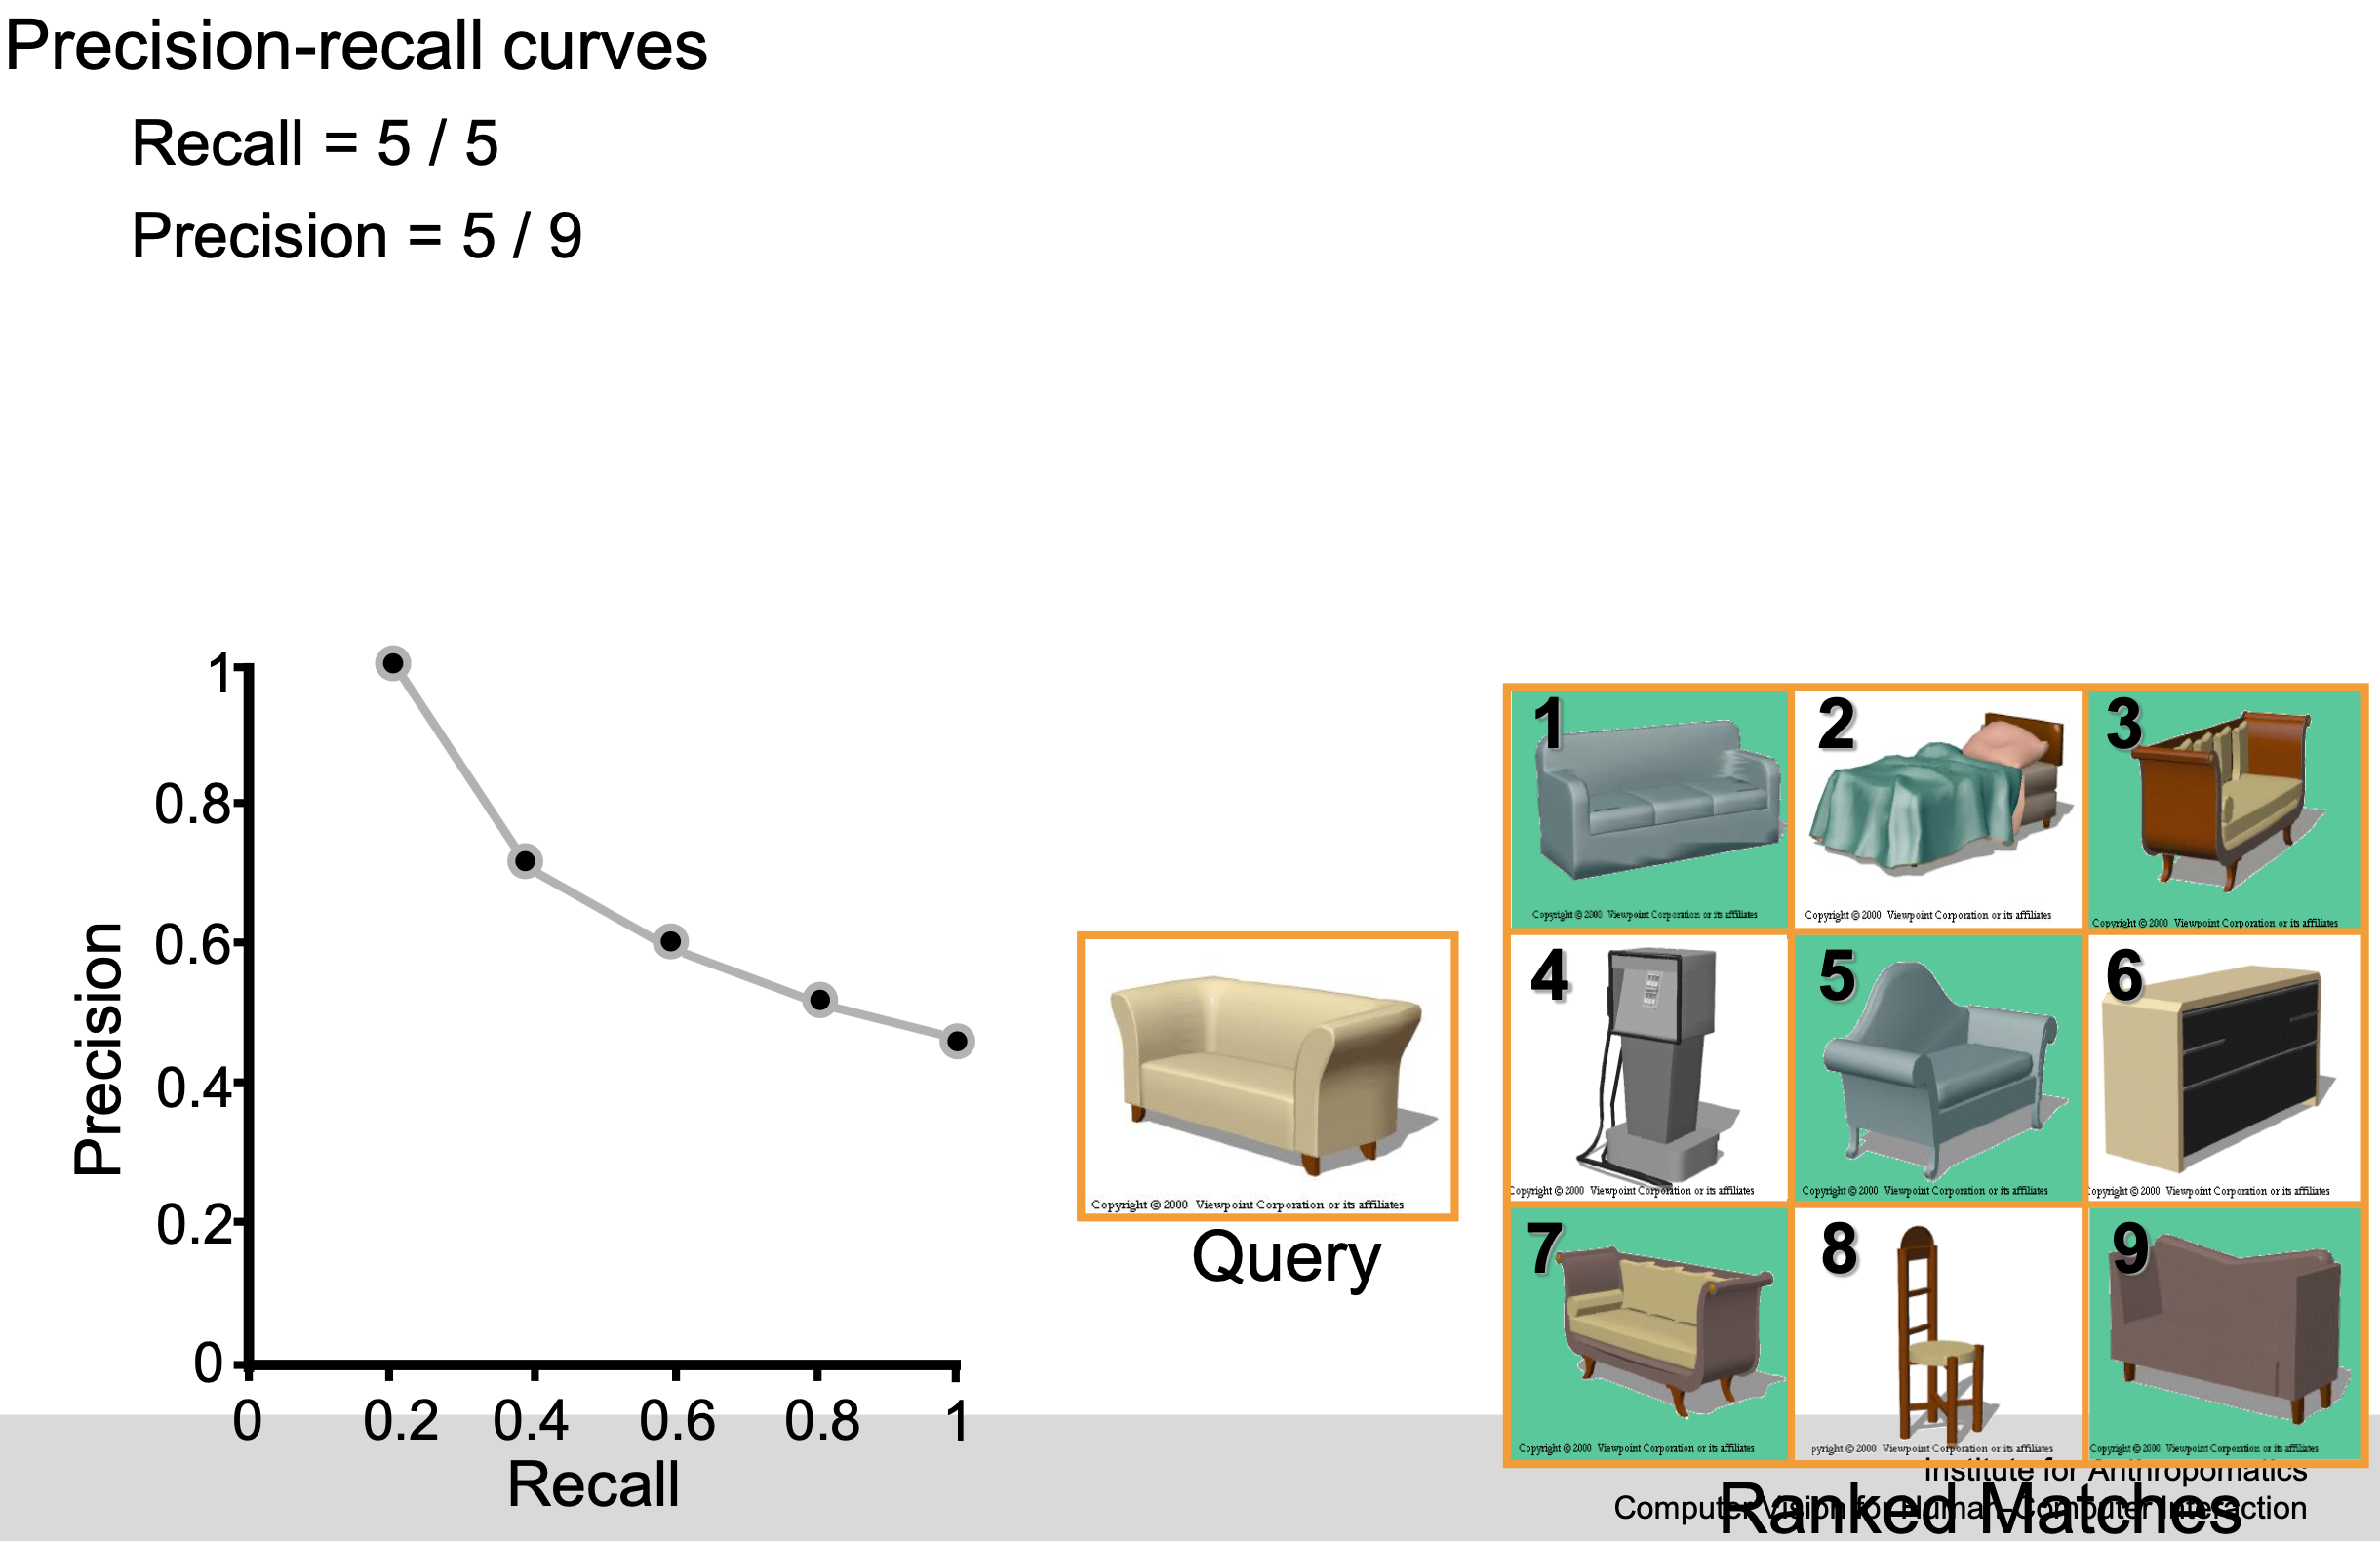
Precision
How many selected items are relevant?
$$ \text{ Precision } = \frac{TP}{TP + FP} =\frac{\\# \text{ relevant item retrieved }}{\\# \text{ of items retrieved }} $$Recall / True Positive Rate (TPR) / Sensitivity
How many relevant items are selected?
$$ \text { Recall } = \frac{TP}{TP + FN} =\frac{\\# \text { relevant item retrieved }}{\\# \text { of relevant items in collection }} $$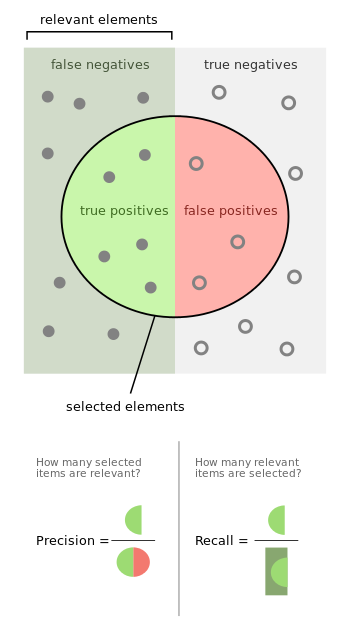
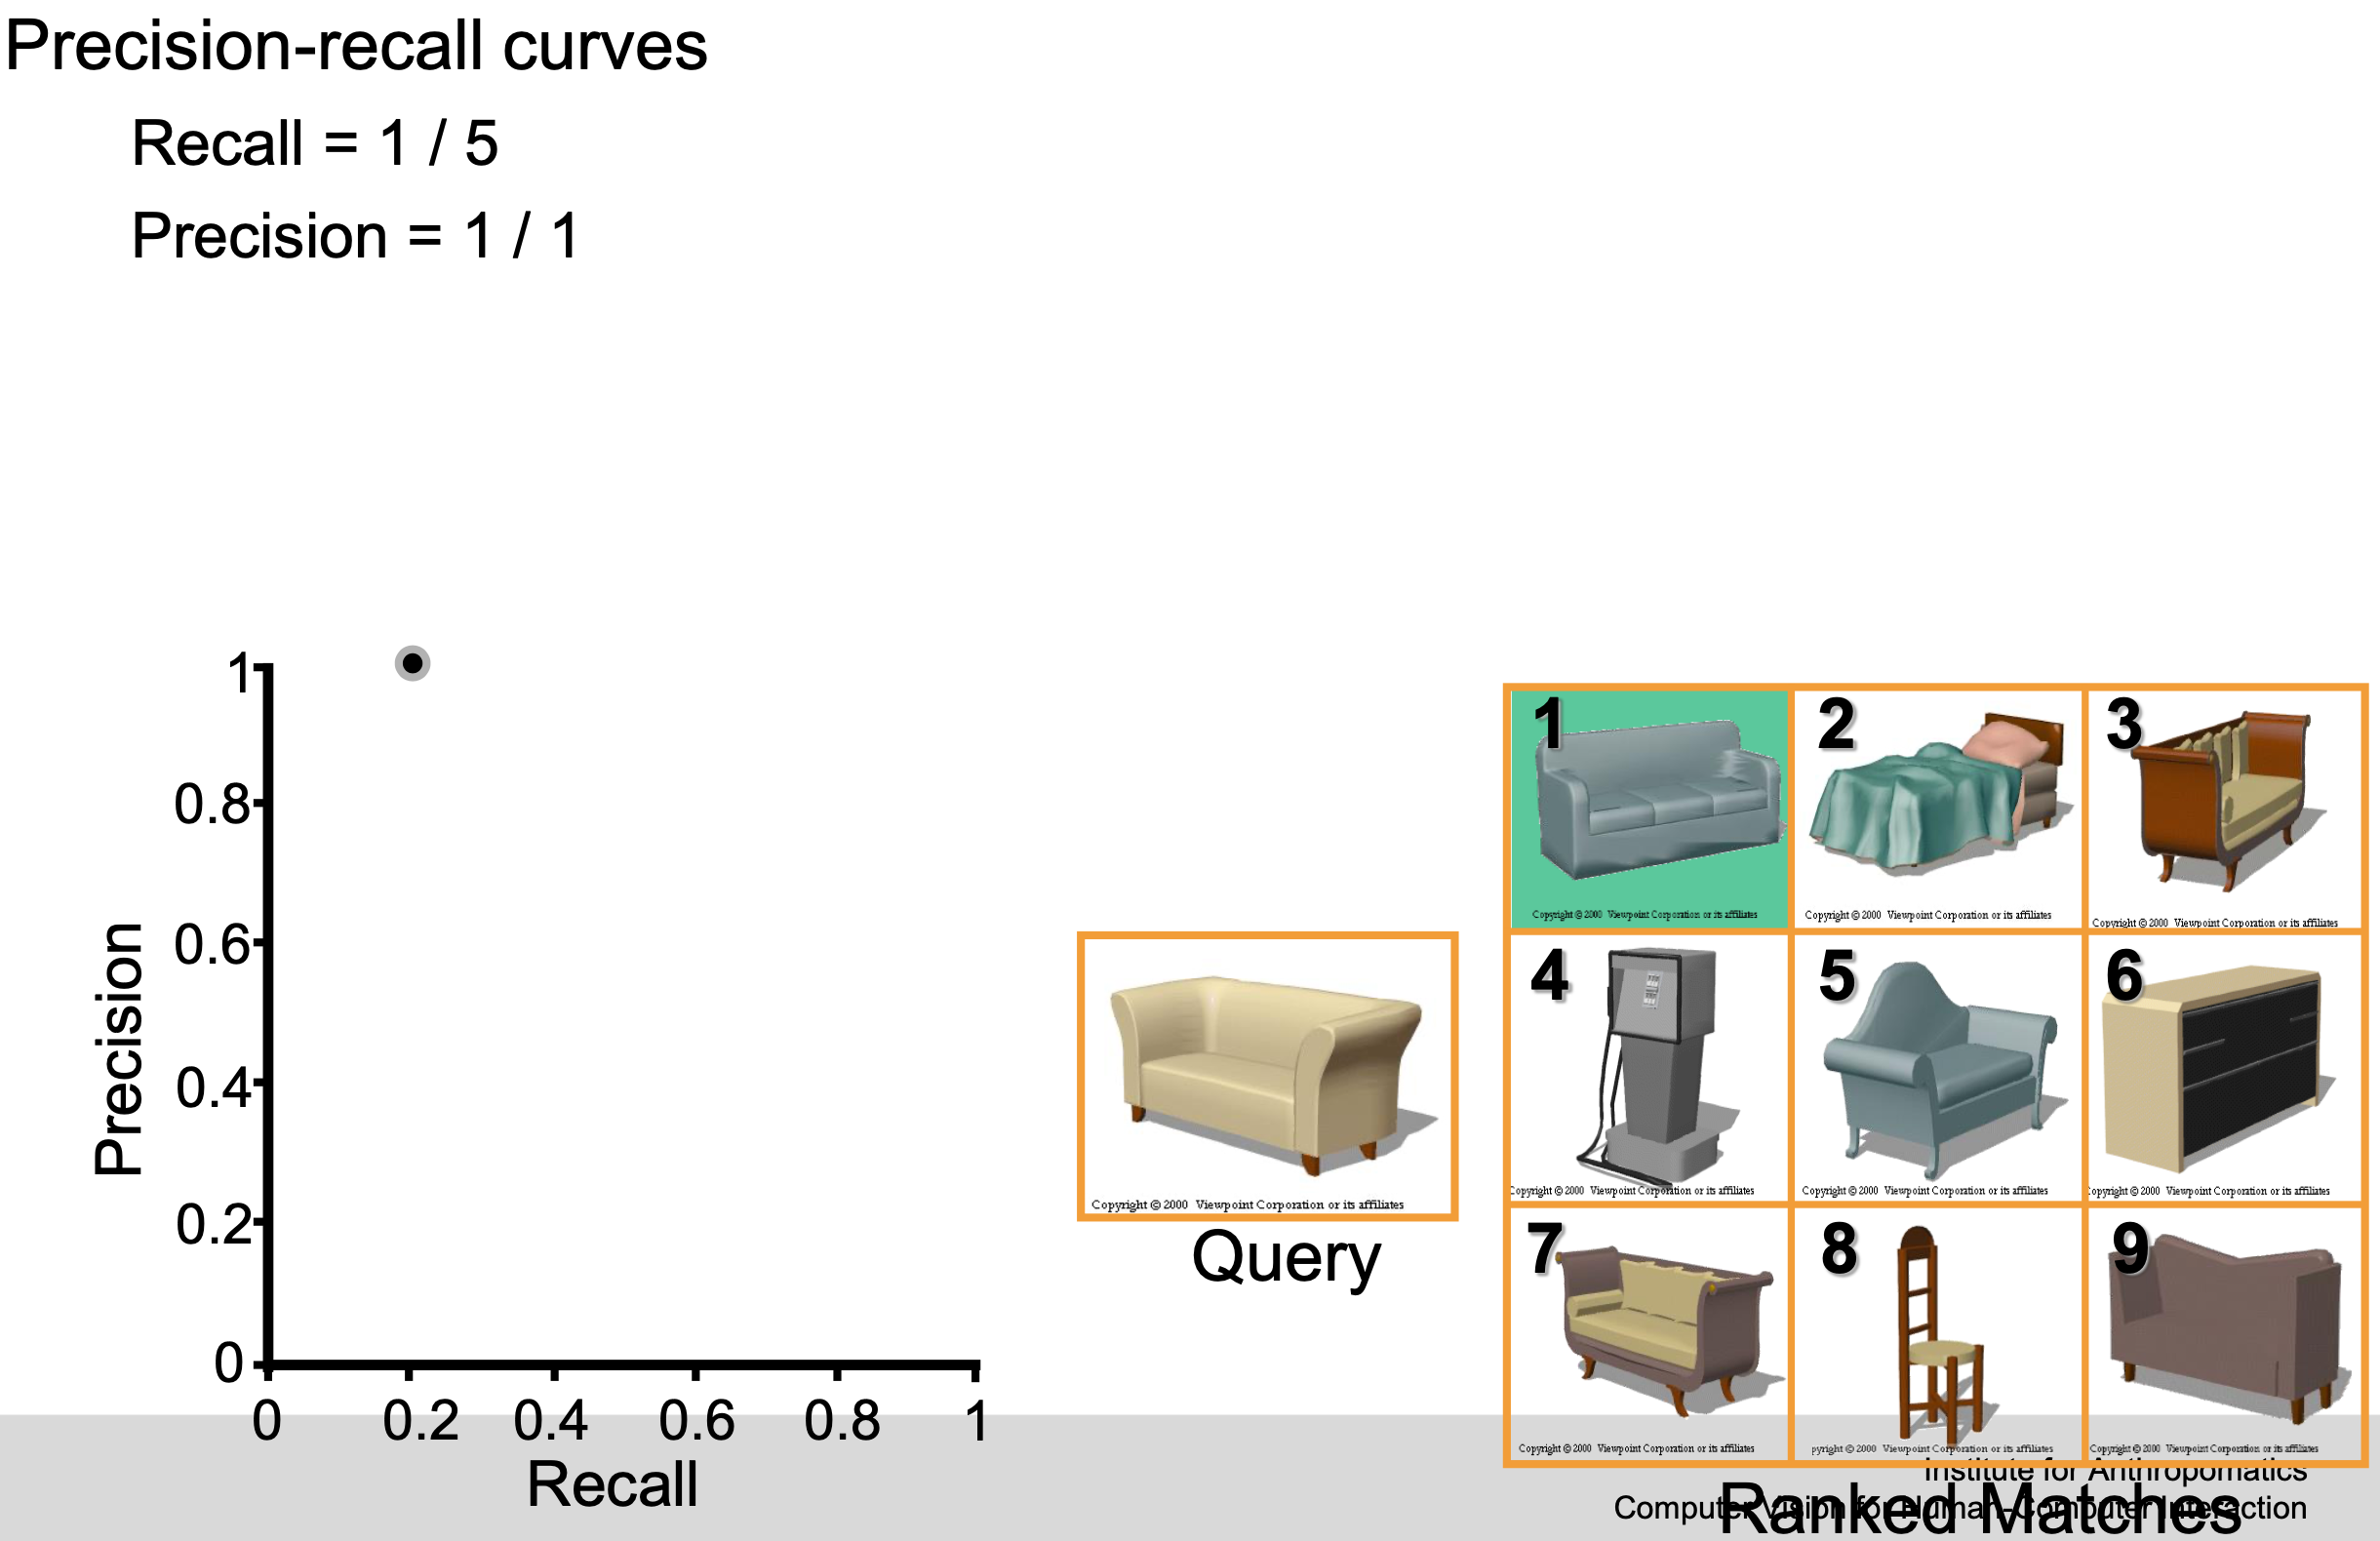
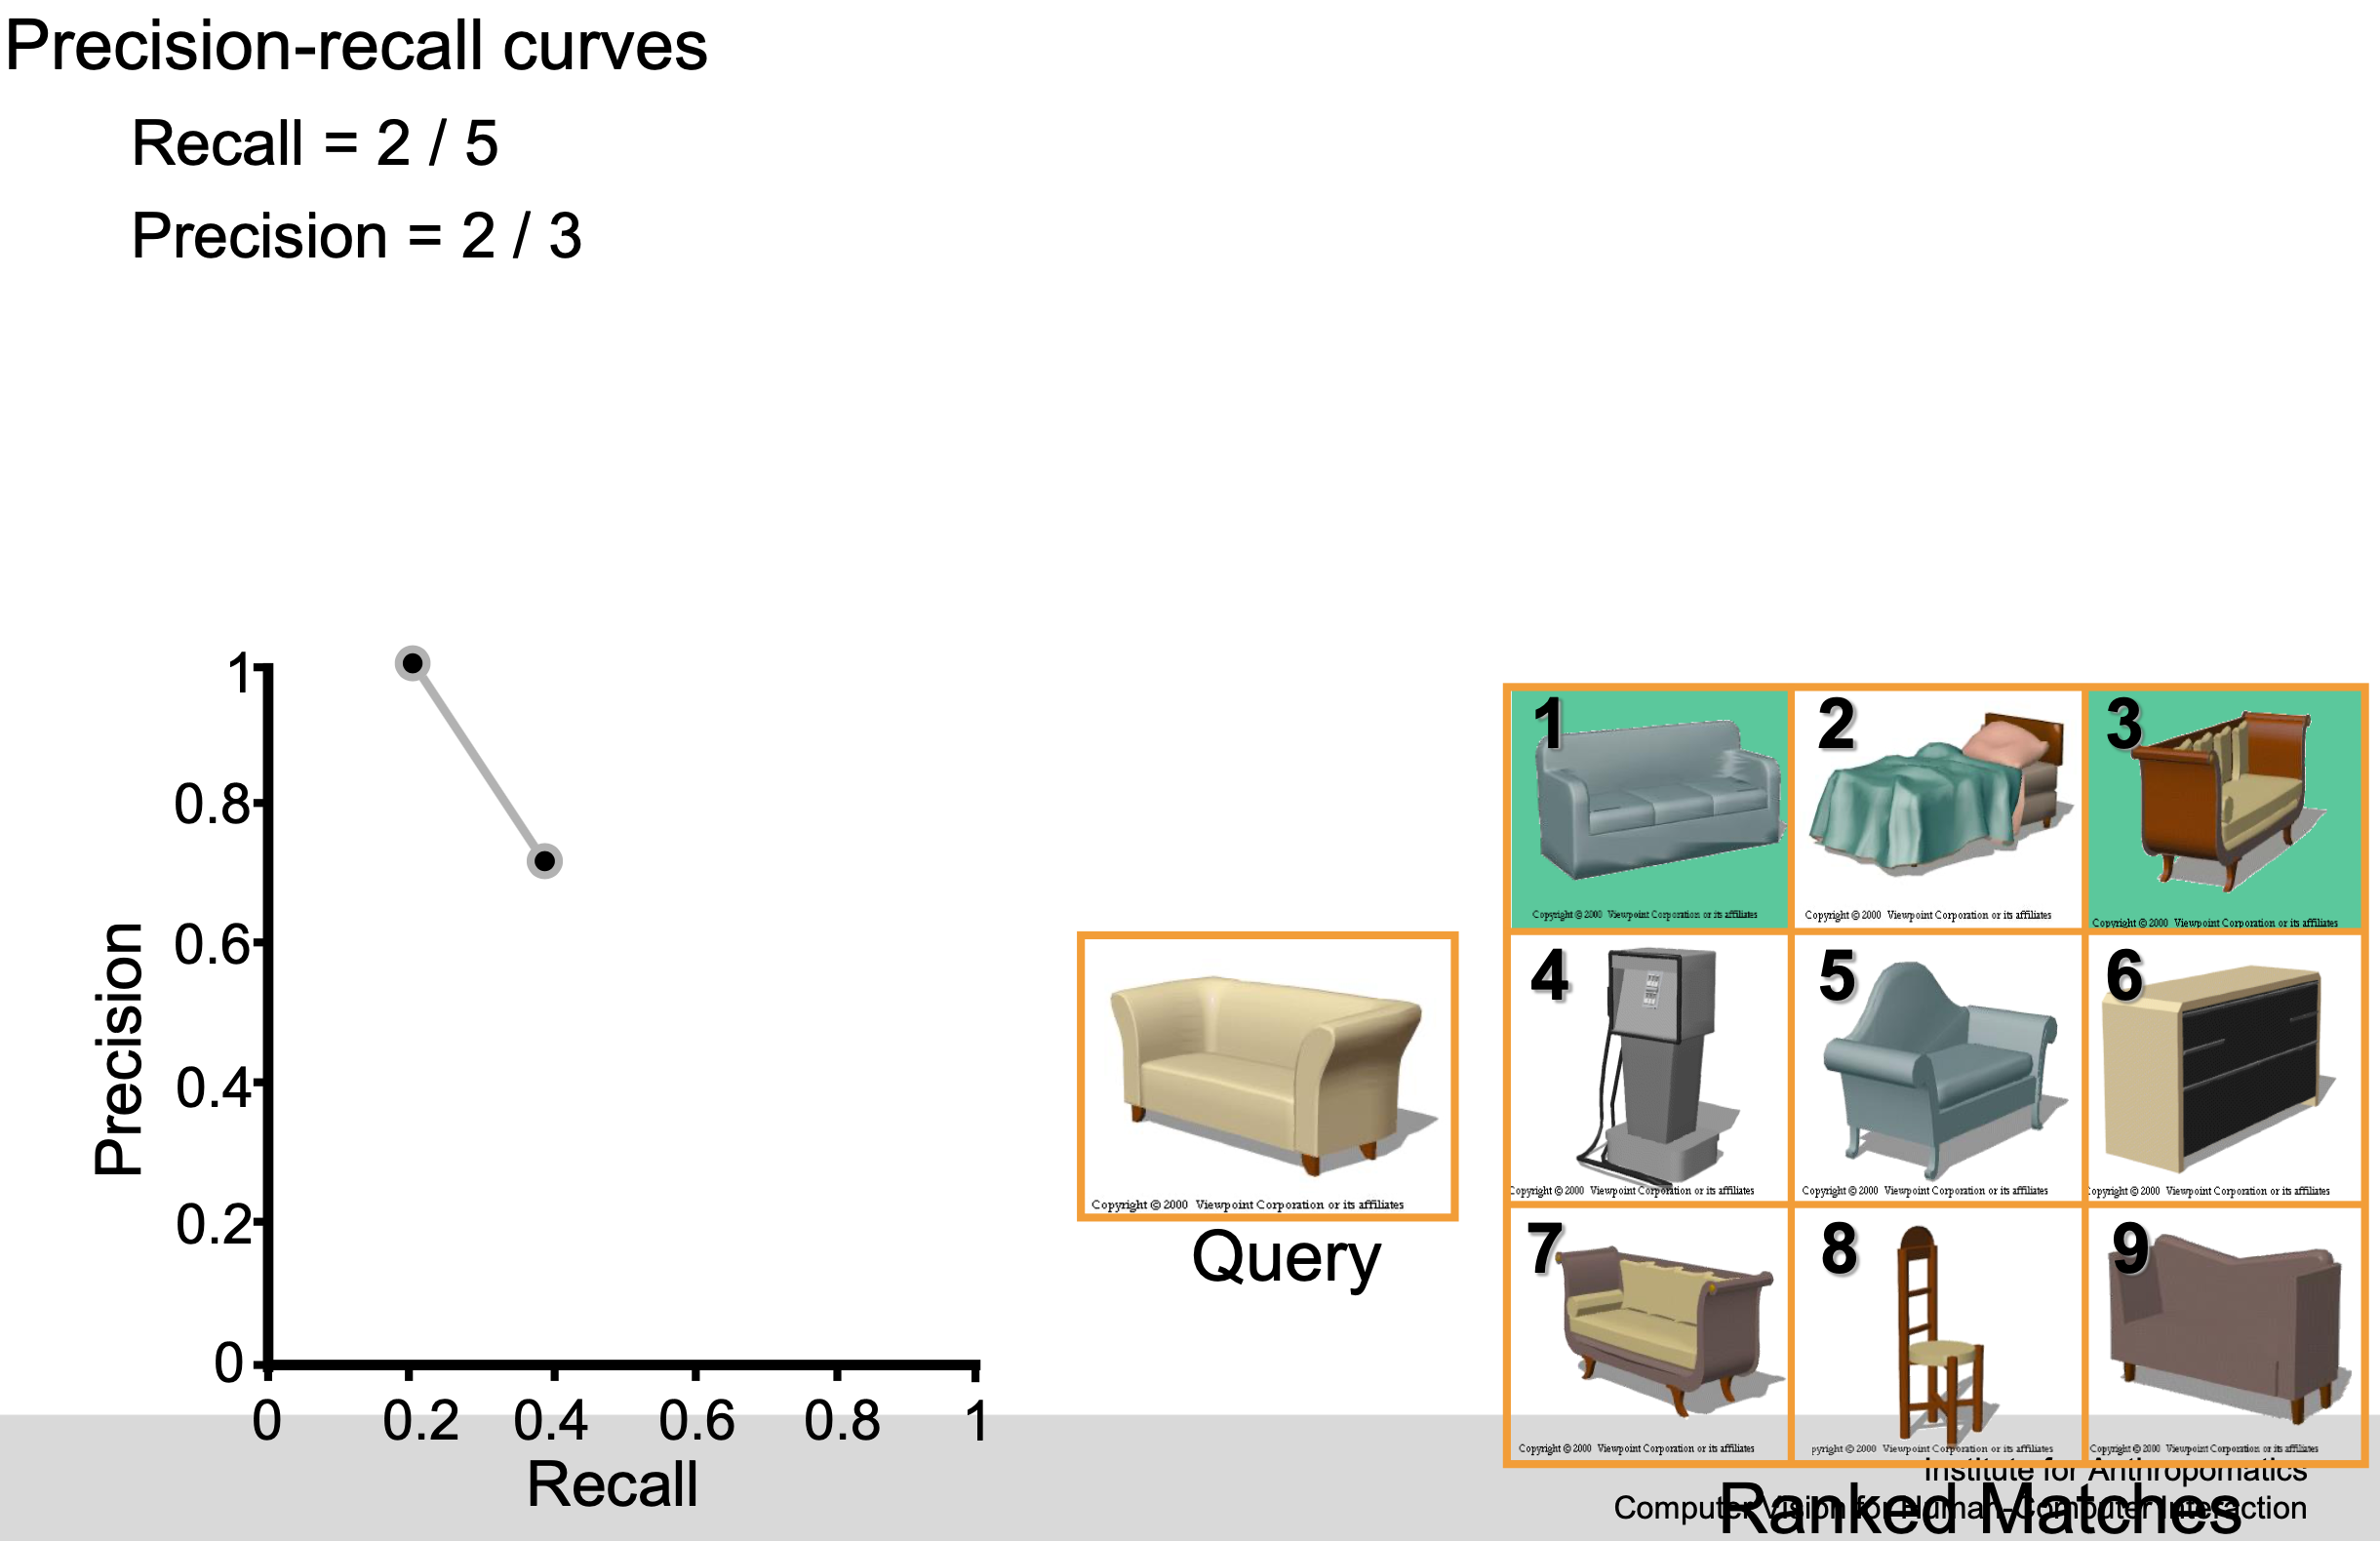
Example
F-score / F-measure
$F\_1$ score
The traditional F-measure or balanced F-score ($F\_1$ score) is the harmonic mean of precision and recall:
$$ F\_1=\frac{2 \cdot \text {precison} \cdot \text {recall}}{\text {precision}+\text {recall}} = \frac{2TP}{2TP + FP + FN} $$$F\_\beta$ score
$F\_\beta$ uses a positive real factor $\beta$, where $\beta$ is chosen such that recall is considered $\beta$ times as important as precision
$$ F\_{\beta}=\left(1+\beta^{2}\right) \cdot \frac{\text { precision } \cdot \text { recall }}{\left(\beta^{2} \cdot \text { precision }\right)+\text { recall }} $$Two commonly used values for $\beta$:
- $2$: weighs recall higher than precision
- $0.5$: weighs recall lower than precision
Specificity
$$ \text{Specifity} = \frac{TN}{FP + TN} $$False Positive Rate (FPR)
$$ \text{FPR} = \frac{FP}{FP + TN} \left(= 1- \frac{TN}{FP + TN} = 1- \text{Specifity}\right) $$Relation between Sensitivity, Specificity, FPR and Threshold
Assuming that the distributions of the actual postive and negative classes looks like this:
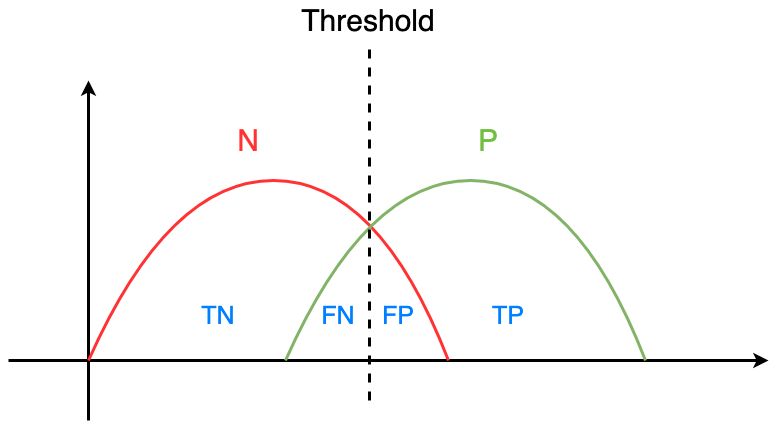
And we have already defined our threshold. What greater than the threshold will be predicted as positive, and smaller than the threshold will be predicted as negative.
If we set a lower threshold, we’ll get the following diagram:
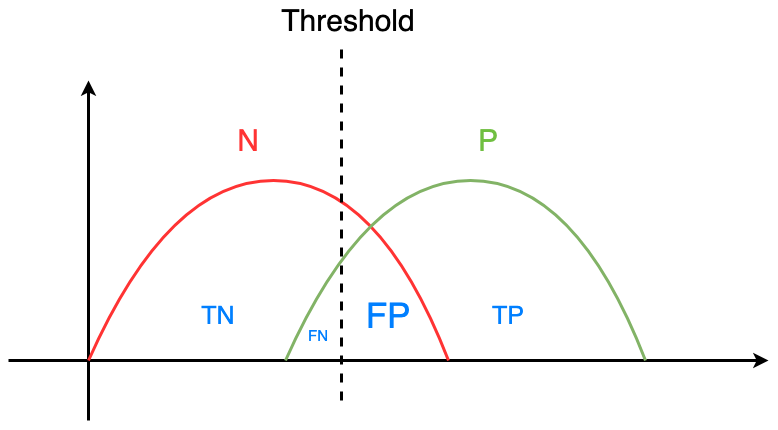
We can notice that FP ⬆️ , and FN ⬇️ .
Therefore, we have the relationship:
- Threshold ⬇️
- FP ⬆️ , FN ⬇️
- $\text{Sensitivity} (= TPR) = \frac{TP}{TP + FN}$ ⬆️ , $\text{Specificity} = \frac{TN}{TN + FP}$ ⬇️
- $FPR (= 1 - \text{Specificity})$⬆️
- And vice versa
AUC-ROC curve
AUC (Area Under The Curve)-ROC (Receiver Operating Characteristics) curve
Performance measurement for the classification problems at various threshold settings.
- ROC is a probability curve
- AUC represents the degree or measure of separability
Tells how much the model is capable of distinguishing between classes.
The higher the AUC, the better the model is at predicting 0s as 0s and 1s as 1s
How is ROC plotted?
for threshold in thresholds: # iterate over all thresholds
    TPR, FPR = classify(threshold) # calculate TPR and FPR based on threshold
    plot_point(FPR, TPR) # plot coordinate (FPR, TPR) in the diagram

connect_points() # connect all plotted points to get ROC curve
Example:
Suppose that the probability of a series of samples being classified into positive classes has been derived and we sort them descendingly:
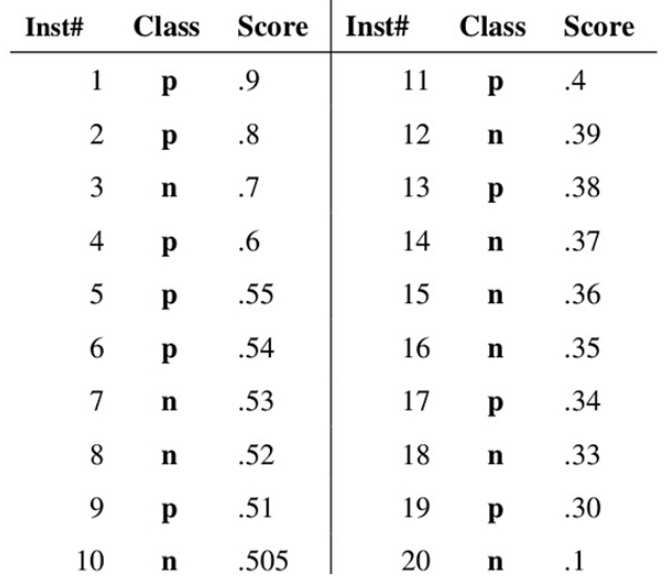
- Class: actual label of test sample
- Score: probability of classifying test sample as positive
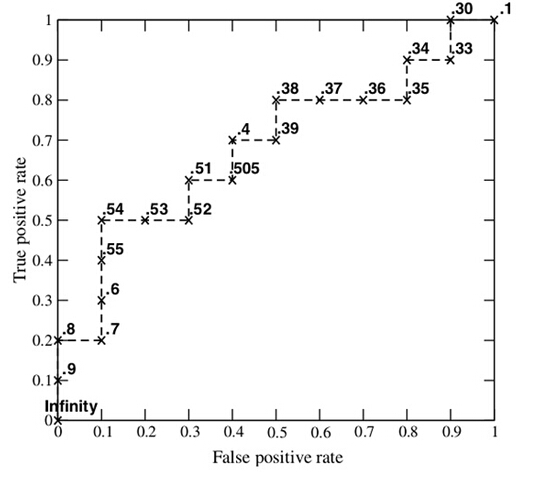
Next, we use the “Score” value as the threshold (from high to low).
When the probability that the test sample is a positive sample is greater than or equal to this threshold, we consider it a positive sample, otherwise it is a negative sample.
- For example, for the 4-th sample, its “Score” has value 0.6. So Sample 1, 2, 3, 4 will be considered as positive, because their “Score” values are $\geq$ 0.6. Other samples are classified as negative.
By picking a different threshold each time, we can get a set of FPR and TPR, i.e., a point on the ROC curve. In this way, we get a total of 20 sets of FPR and TPR values. We plot them in the diagram:
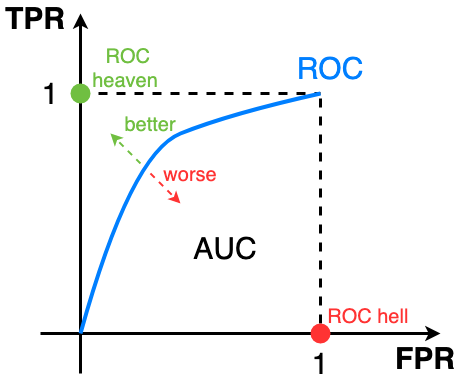
How to speculate about the performance of the model?
An excellent model has AUC near to the 1 which means it has a good measure of separability.
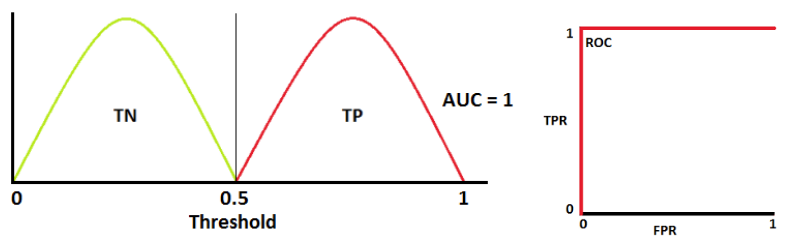
Ideal situation: two curves don’t overlap at all means model has an ideal measure of separability. It is perfectly able to distinguish between positive class and negative class.
When $0.5 < \text{AUC} < 1$, there is a high chance that the classifier will be able to distinguish the positive class values from the negative class values. This is because the classifier is able to detect more numbers of True positives and True negatives than False negatives and False positives.
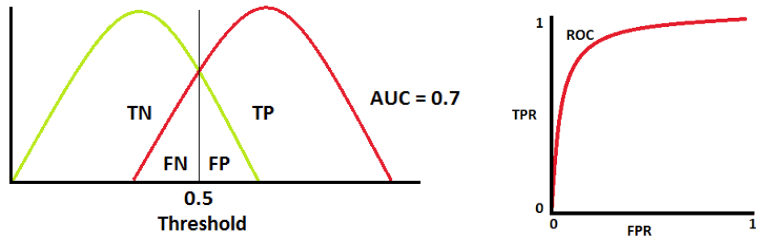
When AUC is 0.7, it means there is a 70% chance that the model will be able to distinguish between positive class and negative class.
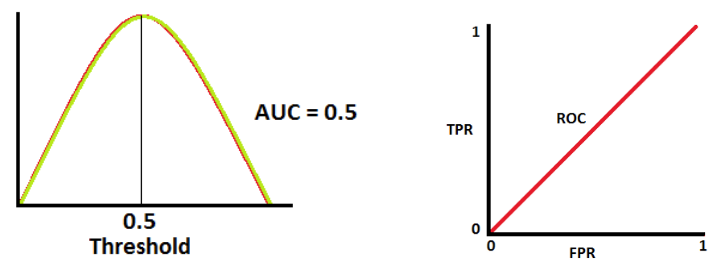
When AUC is 0.5, it means the model has no class separation capacity whatsoever.
A poor model has AUC near to the 0 which means it has the worst measure of separability.
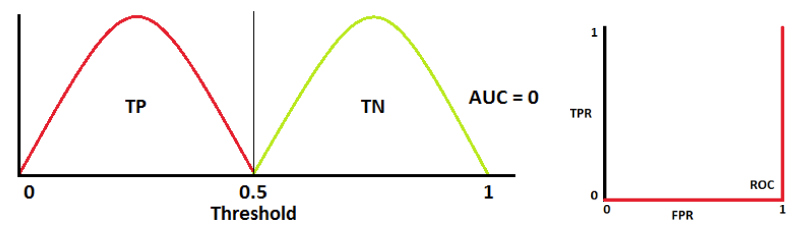
When AUC is approximately 0, the model is actually reciprocating the classes. It means the model is predicting a negative class as a positive class and vice versa.
🎥 Video tutorials
The confusion matrix
Sensitivity and specificity
ROC and AUC
Reference
- Understanding AUC - ROC Curve
- What is the F-score?: very nice explanation with examples
- 机器学习之分类器性能指标之ROC曲线、AUC值