Linear Discriminant Analysis (LDA)
Linear Discriminant Analysis (LDA)
also called Fisher’s Linear Discriminant
reduces dimension (like PCA)
but focuses on maximizing seperability among known categories
💡 Idea
- Create a new axis
- Project the data onto this new axis in a way to maximize the separation of two categories
How it works?
Create a new axis
According to two criteria (considered simultaneously):
Maximize the distance between means
Minimize the variation (which LDA calls “scatter”) within each category
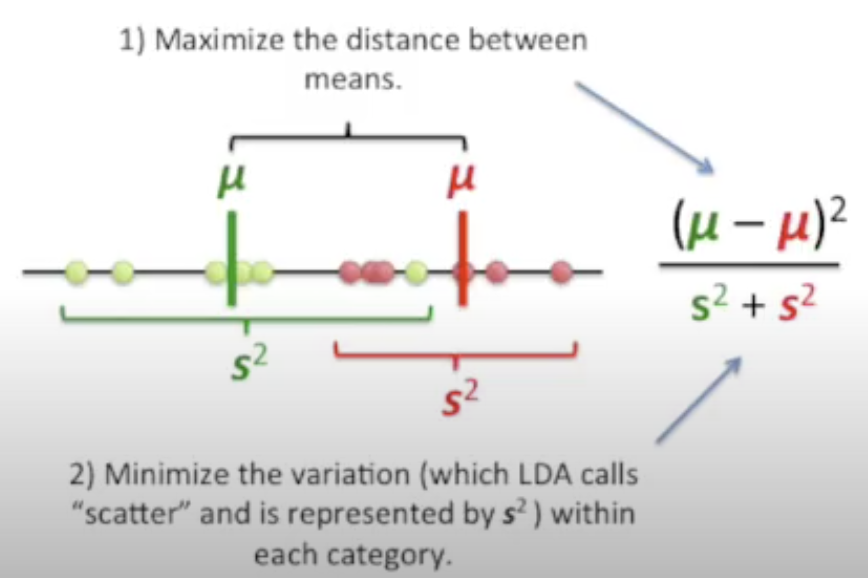
We have:
Why both distance and scatter are important?
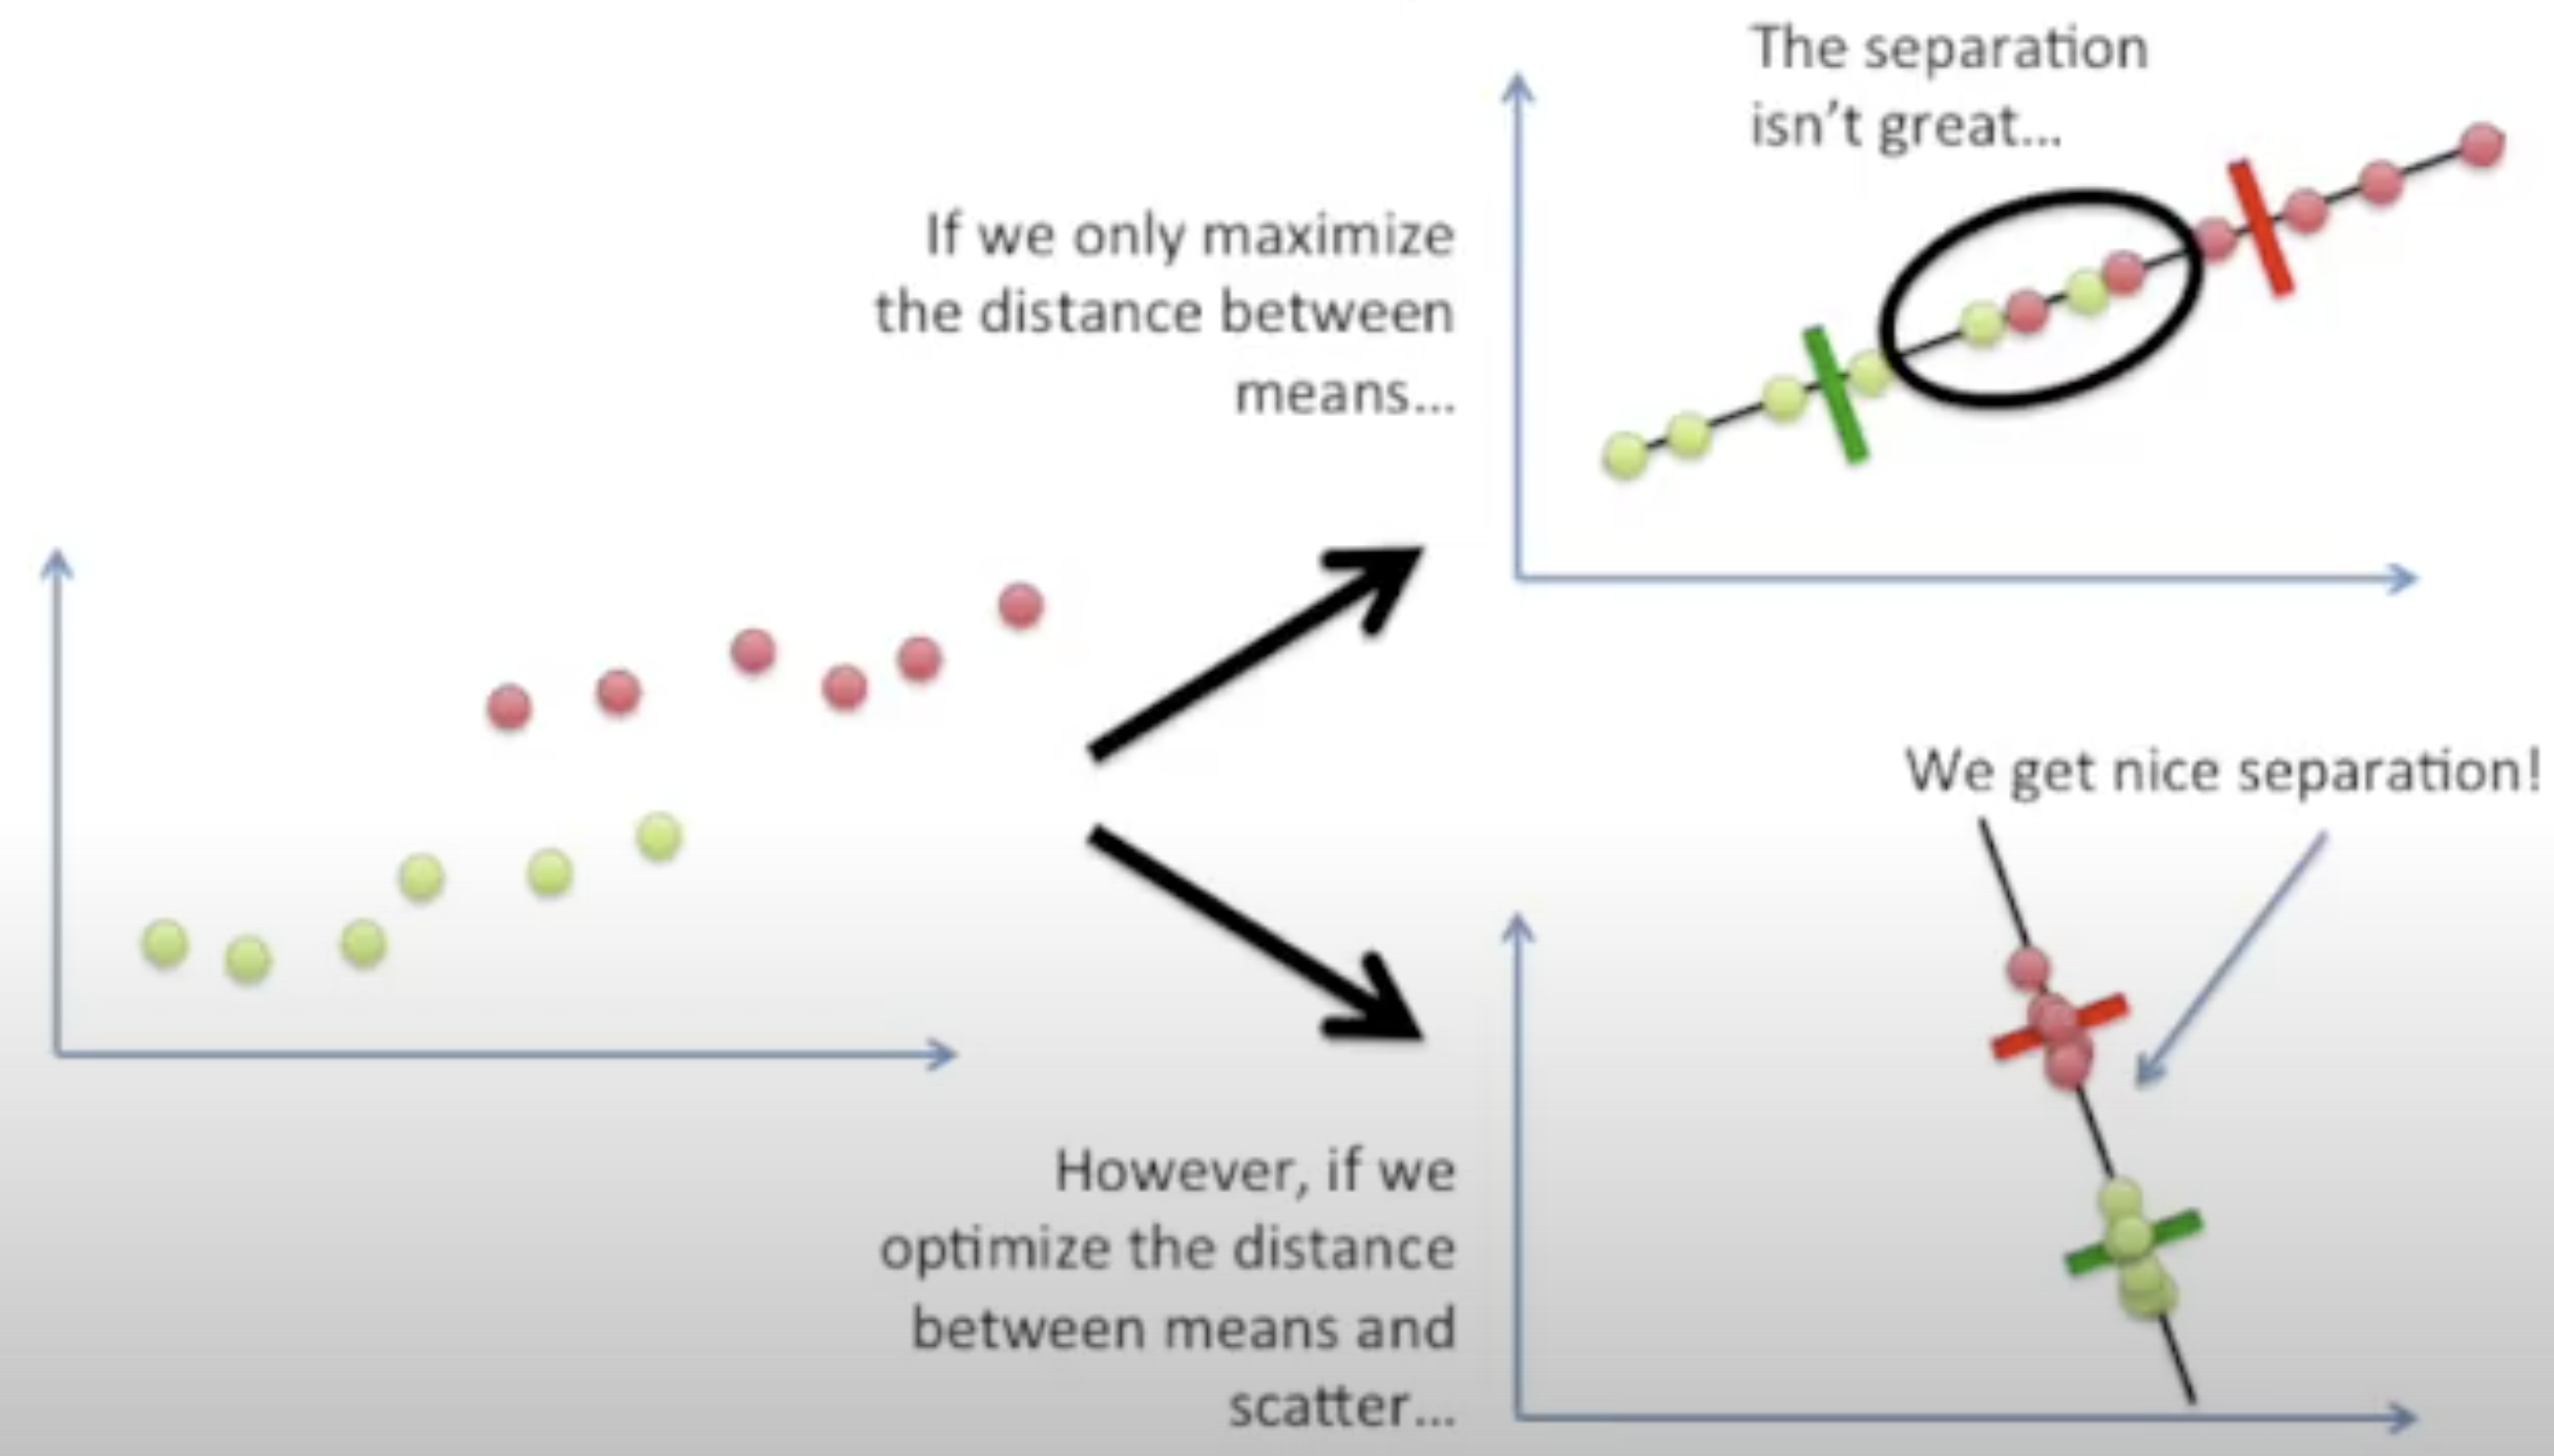
More than 2 dimensions
The process is the same 👏:
Create an axis that maximizes the distance between the means for the two categories while minimizing the scatter
More than 2 categories (e.g. 3 categories)
Little difference:
Measure the distances among the means
Find the point that is central to all of the data
Then measure the distances between a point that is central in each category and the main central point
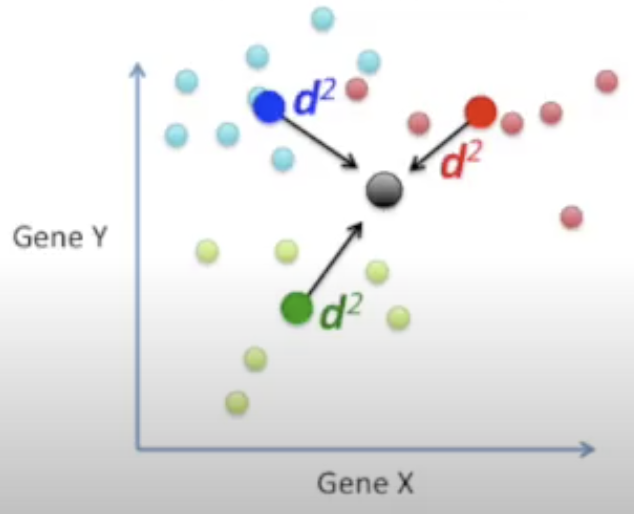
Maximize the distance between each category and the central point while minimizing the scatter for each category
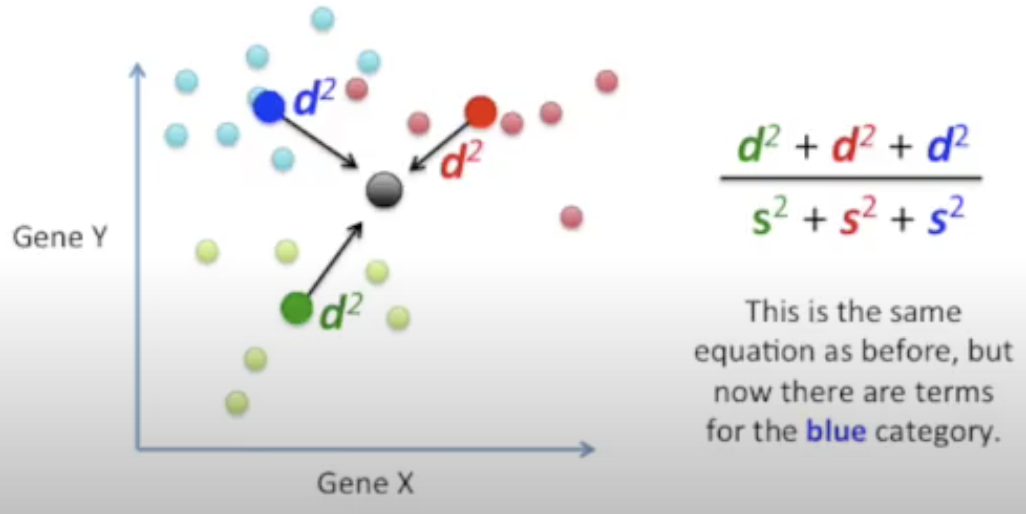
Create 2 axes to separate the data (because the 3 central points for each category define a plane)
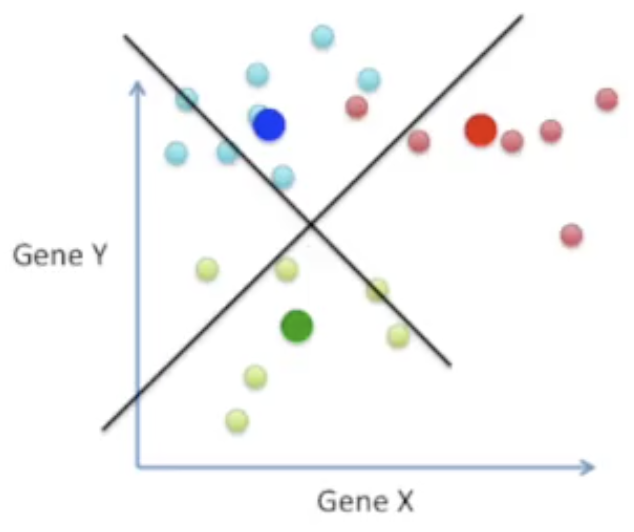
LDA and PCA
Similarities
Both rank the new axes in order of importance
- PC1 (the first new axis that PCA creates) accounts for the most variation in the data
- PC2 (the second new axis) does the second best job
- LD1 (the first new axis that LDA creates) accounts for the most variation between the categories
- LD2 does the second best job
- PC1 (the first new axis that PCA creates) accounts for the most variation in the data
Both can let you dig in and see which features are driving the new axes
Both try to reduce dimensions
- PCA looks at the features with the most variation
- LDA tries to maximize the separation of known categories