📈 Visualization with TensorBoard
TL;DR
Define network structure, loss function, optimizer
Set up TensorBoard
Import
SummaryWriterfromtorch.utils.tensorboardDefine
SummaryWriter
   from torch.utils.tensorboard import SummaryWriter

   # let's say we'll log for "fashion_mnist_experiment_1"
   NAME = "fashion_mnist_experiment_1"

   # default `log_dir` is "./runs"
   writer = SummaryWriter(f'runs/{LOG_DIR}')
Launch TensorBoard
- If we launch in Jupyter Notebook/Lab or Google Colab, we need to load the TensorBoard notebook extension first
%load_ext tensorboard %tensorboard --logdir=runs- If we run on terminal, execute the command
tensorboard --logdir=runsThen go to the URL it provides OR to http://localhost:6006/
Inspect the model
using
add_graph()remember to call
writer.close()
# assume that net is our neural network
# and images are a batch of training images

writer.add_graph(net, images)
writer.close()
Track model training with
add_scalar()Access trained models
- Precision-Recall curve:
add_pr_curve()
- Precision-Recall curve:
Useful functions
add_scalar()1
Add scalar data to summary.
- Scalar helps to save the loss value of each training step, or the accuracy after each epoch.
Lots of information can be logged for one experiment. To avoid cluttering the UI and have better result clustering, we can group plots by naming them hierarchically.
- For example, “Loss/train” and “Loss/test” will be grouped together.
writer.add_scalar('Loss/train', np.random.random(), n_iter)
    writer.add_scalar('Loss/test', np.random.random(), n_iter)
    writer.add_scalar('Accuracy/train', np.random.random(), n_iter)
    writer.add_scalar('Accuracy/test', np.random.random(), n_iter)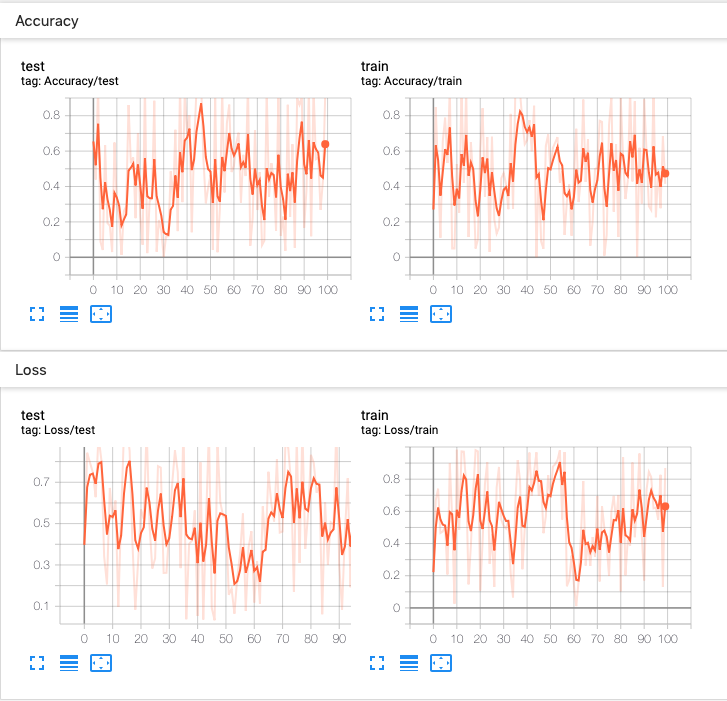
add_scalars() 2
Adds many scalar data in the same plot to summary.
Use case: compare train loss and validation loss to see if it’s overfitting
Example:
from torch.utils.tensorboard import SummaryWriter
writer = SummaryWriter()
r = 5
for i in range(100):
    writer.add_scalars('run_14h', {'xsinx':i*np.sin(i/r),
                                    'xcosx':i*np.cos(i/r),
                                    'tanx': np.tan(i/r)}, i)
writer.close()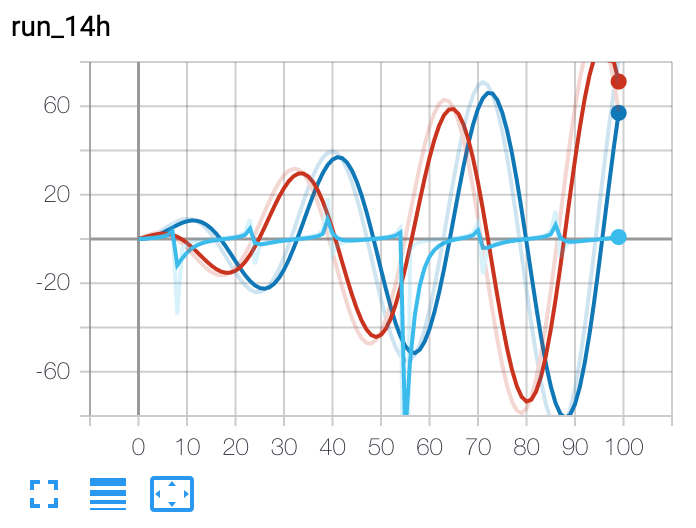
Google Colab Notebook
Resource
- tensorboardX documentation
- HOW TO USE TENSORBOARD WITH PYTORCH
- Pytorch documentation: TORCH.UTILS.TENSORBOARD