Manage Risk
- Manage risk
  - Understanding risk management
    - Importance
    - Phase
      - Identify
      - Analyze
      - Evaluate
      - Treat
      - Monitor and control
  - Identifying and assessing risks
    - Tools
      - Brainstorming
        - Cause-and-effect diagram (fishbone diagram)
      - Risk assessment
        - Probability and impact matrix
    - Risk types
      - Time
      - Budget
      - Scope
      - External
      - Single point of failure
    - Dependency types
      - Finish to Start (FS)
      - Finish to Finish (FF)
      - Start to Start (SS)
      - Start to Finish (SF)
  - Mitigating and communicating risks
    - Strategies
      - Avoid
      - Accept
      - Reduce or control
      - Transfer
    - Building a risk management plan
    - Communicating risk to stakeholders
Understanding Risk Management
The importance of risk management
Risk: A potential event which can occur and can impact your project.
Issue: A known or real problem that can affect the ability to complete a task.
Risk management: The process of identifying and evaluating potential risks and issues that could impact a project.
Risk management provides and understanding of
- What could go wrong
- Who you’ll need to consult
- How the risk could be mitigated
-> This way, if or when something goes wrong, you’ll have a plan prepared and ready to go. Part of being proactive and planning ahead is identifying potential risks and how to solve for them. This way, you’ll set up your project with better chances for success.
Failing to engage in meaningful risk management can have a few big consequences for your project
- If you don’t plan ahead, you may put your project at risk of not meeting its project goal, its timelines, or success criteria.
- By failing to plan for risks, you also fail to think through the many different ways that your project could pivot and still meet its goals.
- Risks can affect projects in a variety of ways that are difficult to foresee.
Issues will come up throughout the project you did not or could not have planned for, and that’s okay. When these moments arise, it is important to keep calm, figure out the root cause of the problem, and come up with a solution.
Phases of risk management
Risk management is an ongoing practice throughout the life cycle of your project. It typically involves some variation of these five steps:
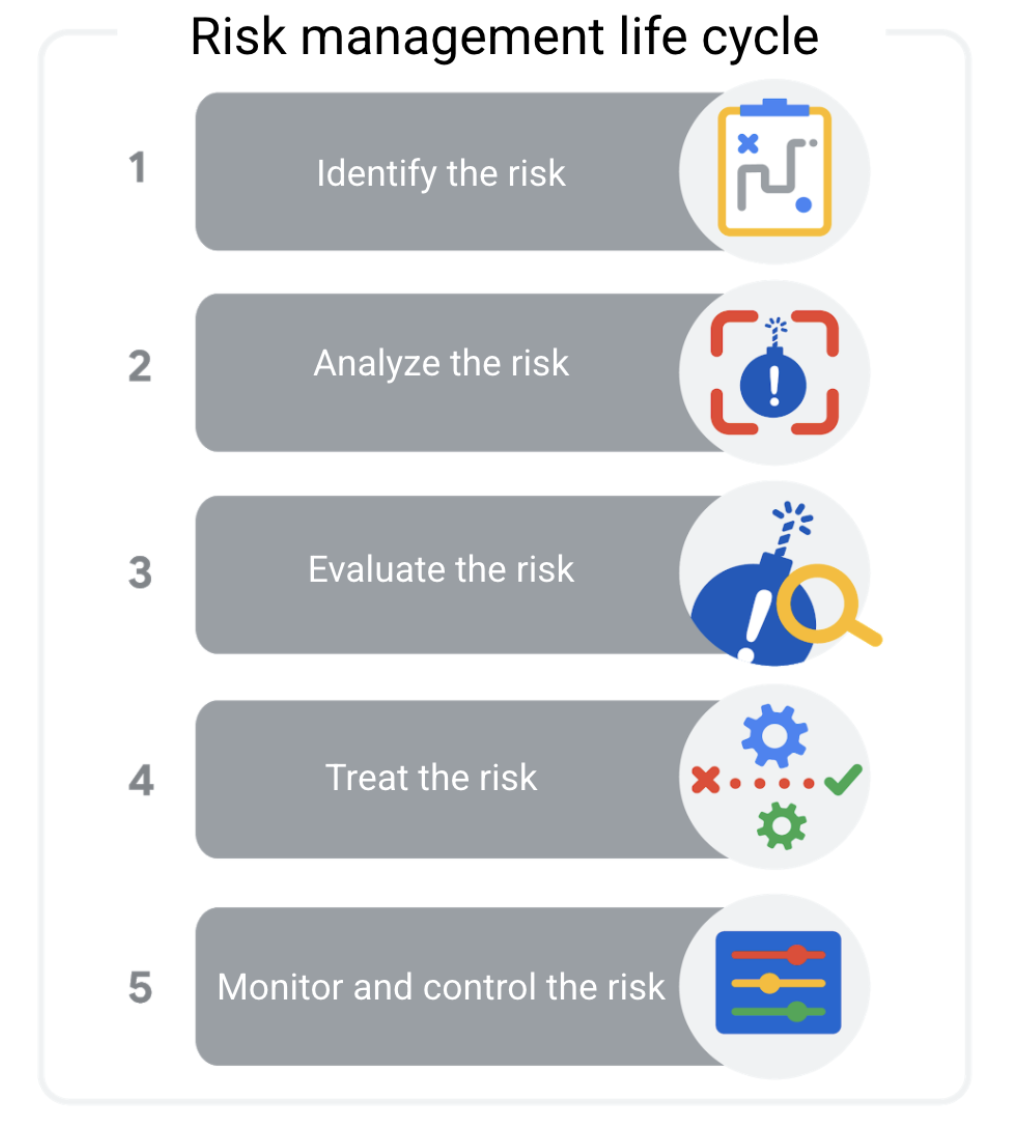
Identify the risk.
The first phase of the risk management process is to identify and define potential project risks with your team. After all, you can only manage risks if you know what they are.
Analyze the risk.
After identifying the risks, determine their likelihood and potential impact to your project. Serious risks with a high probability of occurring pose the greatest threat.
Evaluate the risk.
Use the results of your risk analysis to determine which risks to prioritize.
Treat the risk.
During this phase, make a plan for how to treat and manage each risk. You might choose to ignore minor risks, but serious risks need detailed mitigation plans.
Monitor and control the risk.
Finally, assign team members to monitor, track, and mitigate risks if the need arises.
Uncover opportunities using risk management
When identifying risks, it is important to also consider the good things that could happen, which are considered opportunities. An opportunity is a potential positive outcome of a risk.
It is important to recognize opportunities and to capitalize on them as they appear so you can reach your project goals faster, more cheaply, or with less effort. Some examples of opportunities include:
- Completing a milestone ahead of schedule
- Discounted materials
- Availability of additional resources (people, investments, equipment)
Identifying and Assessing Risks
Tools to help identify risks
Brainstorming
Brainstorming is one of the most effective techniques for identifying risks with the team because it allows groups to spontaneously share ideas without judgment.
As a project manager, you will be responsible for bringing a group of people together to imagine potential risks
- Have your RACI chart at the ready to refer to when you decide who to invite to this meeting.
- The best team for this task is a diverse one, which includes individuals from various roles, backgrounds, and experiences. Diverse teams bring different perspectives, experiences, and skill sets, and this may help you to identify risks that you may not have thought of on your own.
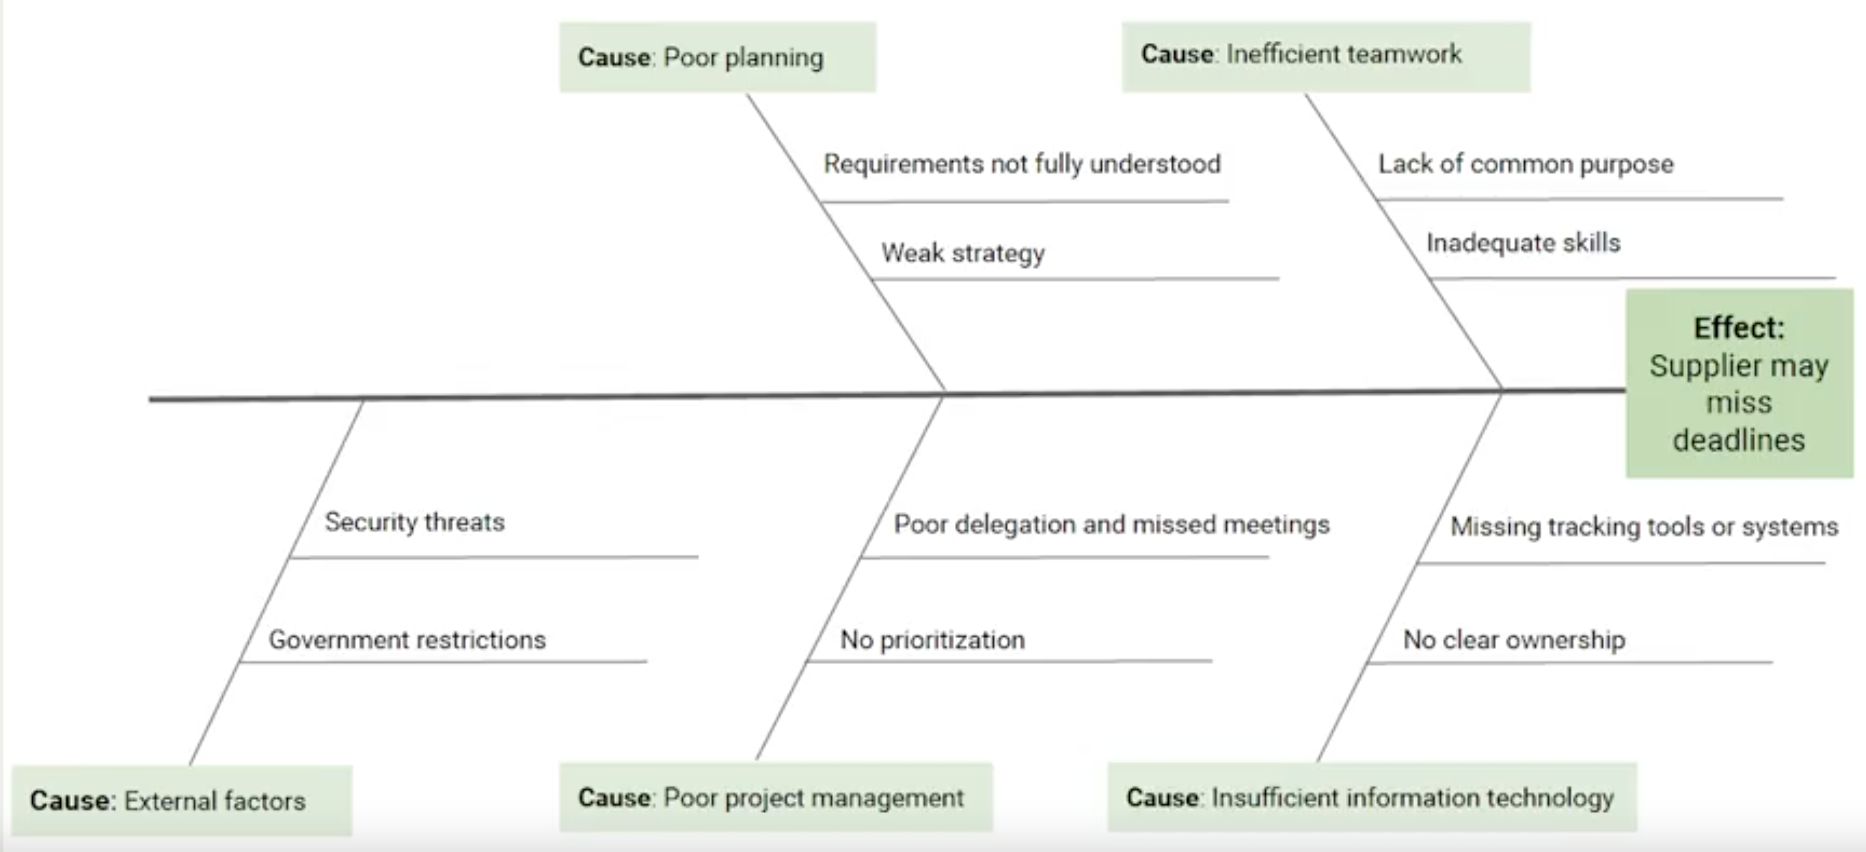
Tool: Cause-and-effect diagram (a.k.a. fishbone diagram)
Shows the possible causes of an event or risk
Can help identify all the ways that things could go wrong by identifying a potential risk, known as the effect, and working backwards to consider the potential causes of that risk.
By categorizing and breaking them down into further causes, you are able to identify areas that could lead to a potential problem, like exceeding your budget or allowing scope creep to impact your timeline.
Example
Risk assessment
During these brainstorming sessions, you might find that your list of potential risks is quite long (and that’s okay). How to decide which risks to focus on?
- List the outcomes from the brainstorm in a risk register, a table or chart that contains your list of risks.
- Adopt a risk assessment technique
- Risk assessment: the stage of risk management where qualities of a risk are estimated or measured.
- Qualities: how likely the risk is to occur and its potential impact on a project.
- Common techique: Probability and impact matrix (for prioritizing project risk)
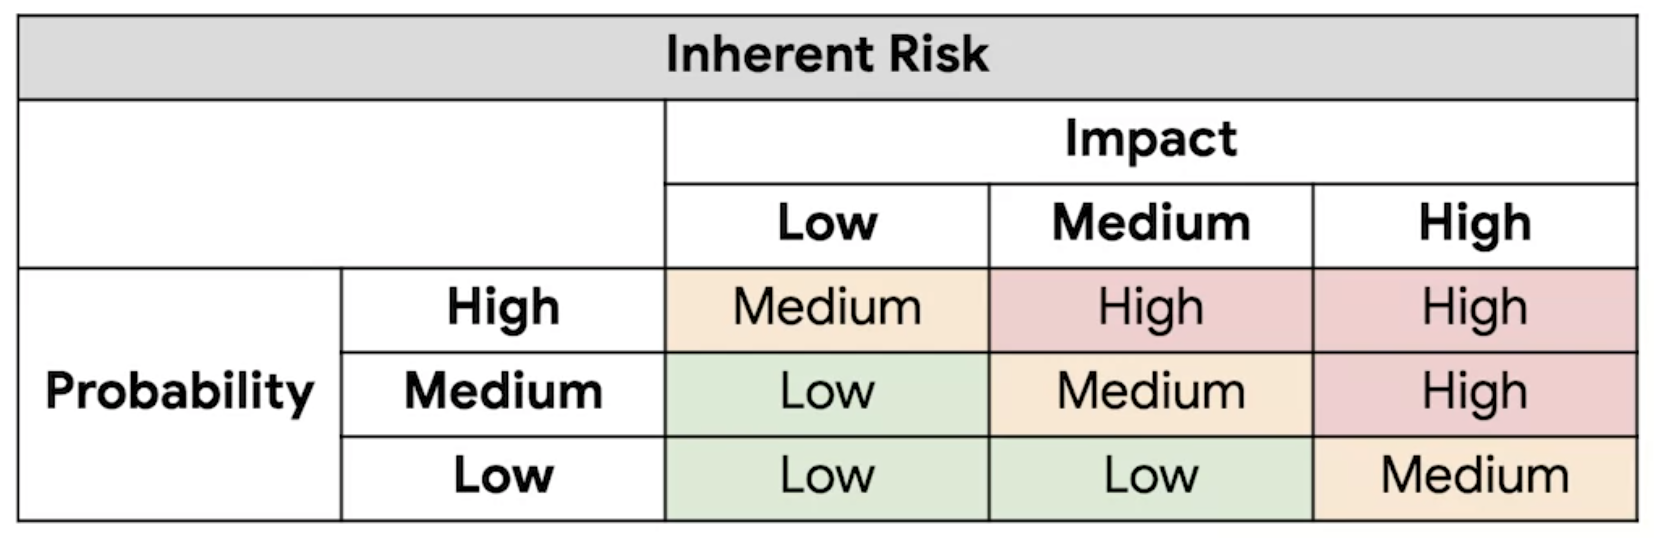
- Impact: The damage a risk could cause if it occurs, which is determined on a scale of high, medium, and low.
- High: If the risk occurs, it will substantially alter the project.
- Low: If the risk occurs, it will have a slight impact but it’s not likely to derail the project.
- Probability: The likelihood that a risk will occur, could also be determined on a scale of high, medium, and low.
- High: There’s a high likelihood of this happening
- Low: A risk could happen, but but it isn’t likely that the risk will occur.
- Inherent risk: The measure of a risk, calculated by its probability and impact
- Low: You don’t need to worry too much about it.
- Medium: you should focus on and create detailed mitigation plans for it
- Certain low-level risks that could result in minor setbacks are much more tolerable than high-level risks that have the potential to completely derail your project.
- Impact: The damage a risk could cause if it occurs, which is determined on a scale of high, medium, and low.
How to create a fishbone diagram
Fishbone diagrams—also known as Ishikawa diagrams or cause-and-effect diagrams — are a visual way to look at cause and effect. They are called fishbone diagrams because they have a similar shape to a fish skeleton.
- Fishbone diagrams help the team to brainstorm potential causes of a problem or risk and sort them into useful categories. These categories show the areas that you should focus on to mitigate that risk.
- Fishbone diagrams are also very helpful in finding the root cause of a problem. A root cause is the initial cause of a situation that introduces a problem or risk.
Case study
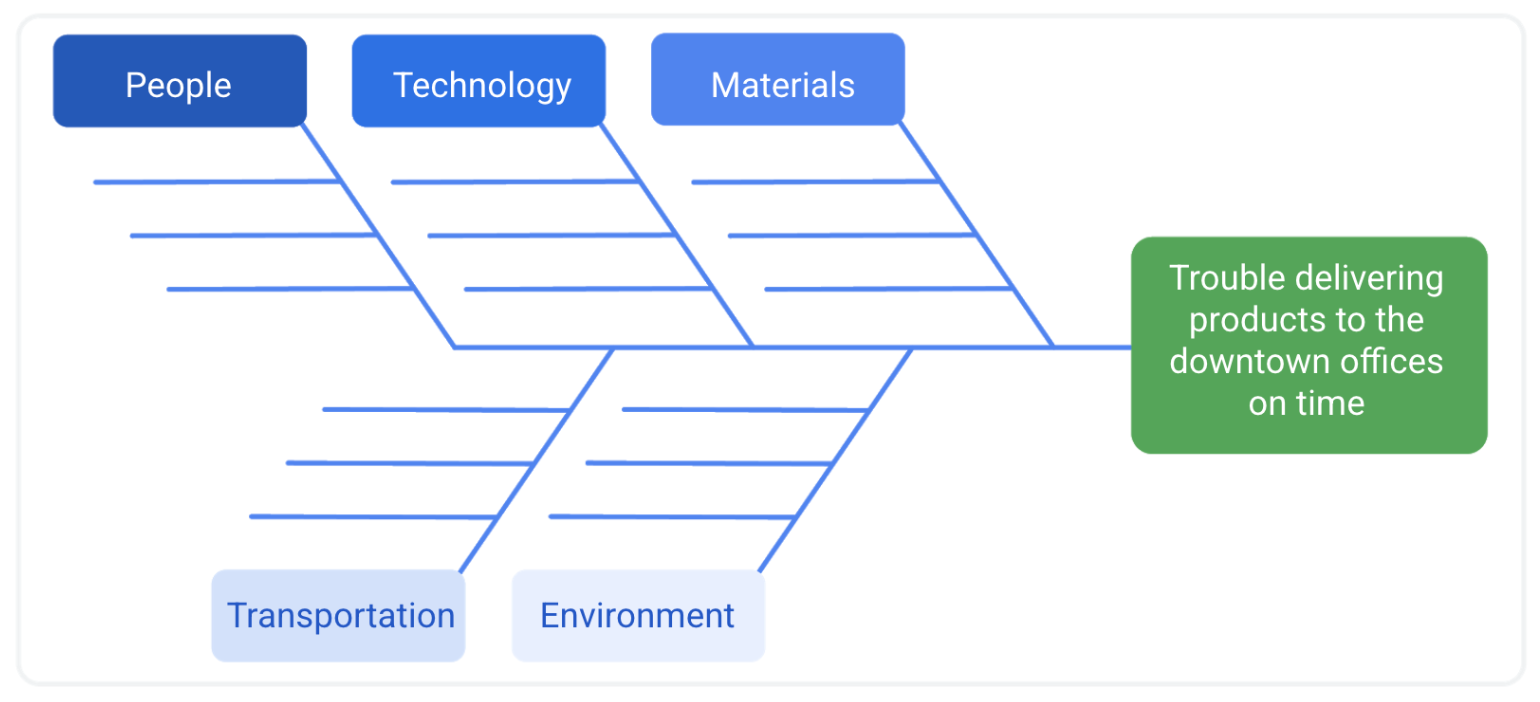
Miguel is a project manager at Office Supply Inc. He is in the planning phase for an upcoming summer promotion project, which will include free delivery of products. In the past, the company has had trouble delivering its products to downtown office buildings on time. Miguel builds a fishbone diagram to see if he can identify some of the possible causes of this problem in order to mitigate this risk on the current project.
He follows these steps to build his diagram:
Define the problem
Miguel states the problem as “trouble delivering products to downtown office buildings on time.” Then he adds the problem to the head of his fishbone diagram.
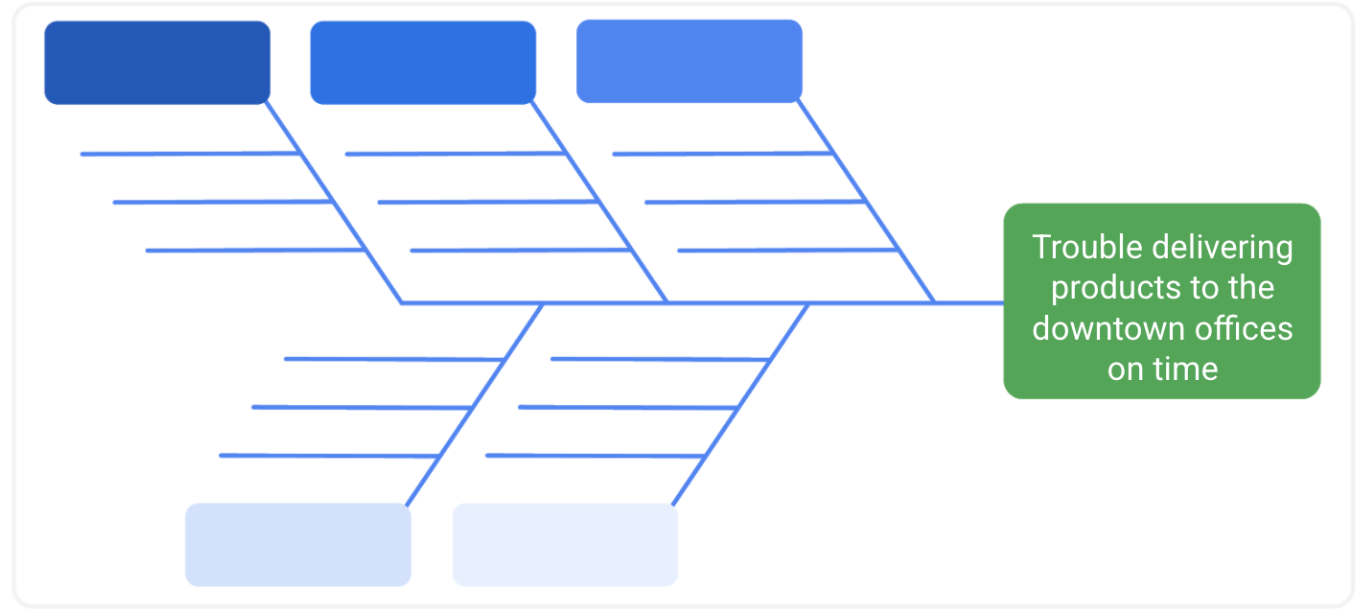
Identify the categories
Miguel thinks of the types of categories that could be causing the problem. These categories will change depending on the type of problem or industry. Some common examples of categories include “people,” “technology,” “materials,” “transportation,” “money,” “time,” “environment,” and “procedures.”
For the delivery problem at Office Supply Inc., Miguel lists the categories “people,” “technology,” “materials,” “transportation,” and “environment” at the top and bottom of the lists to the left of the problem in his fishbone diagram.
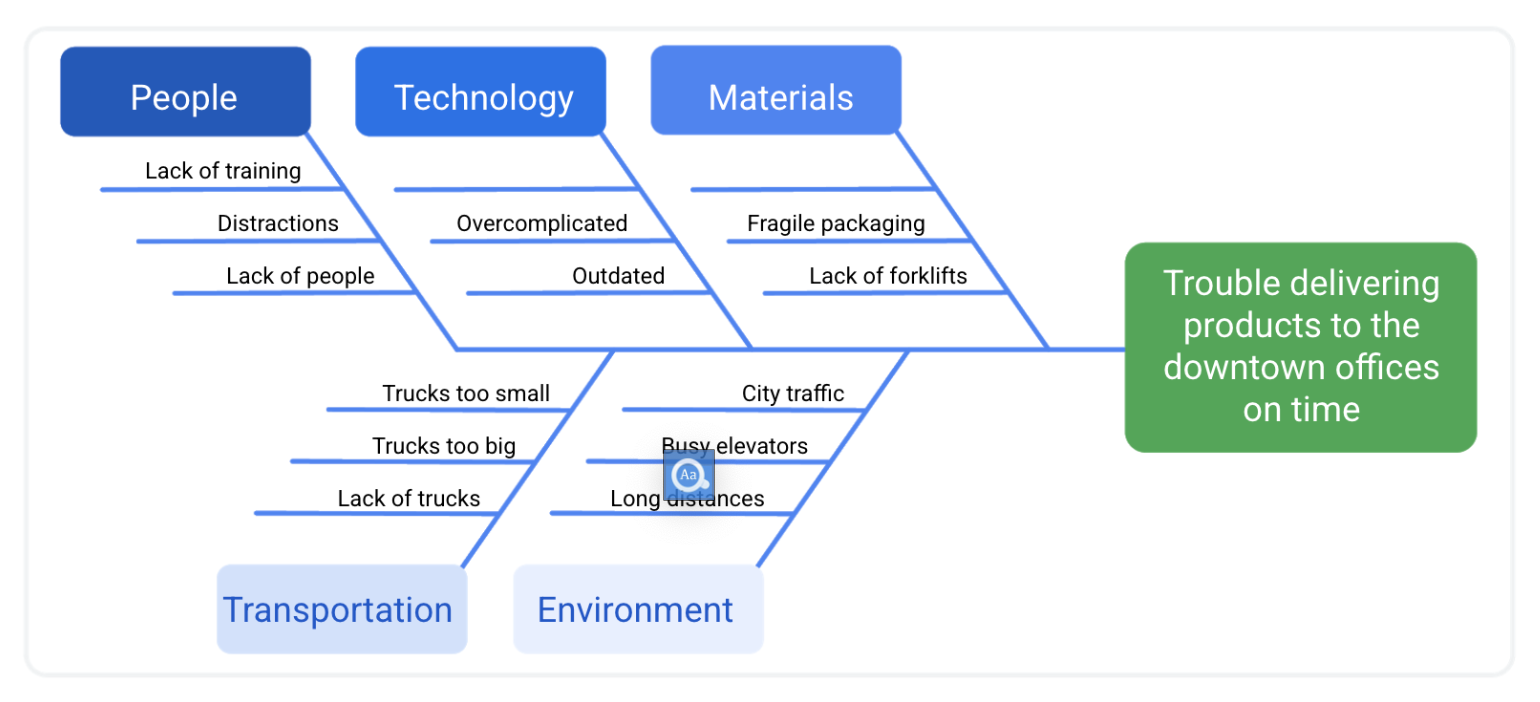
Brainstorm the causes
Miguel has identified possible categories that relate to the risk, he brainstorms areas of concern within each category. He reaches out to his team for help in identifying these possible causes. Then, Miguel fills in the lists with some of the causes that could be related to each category.
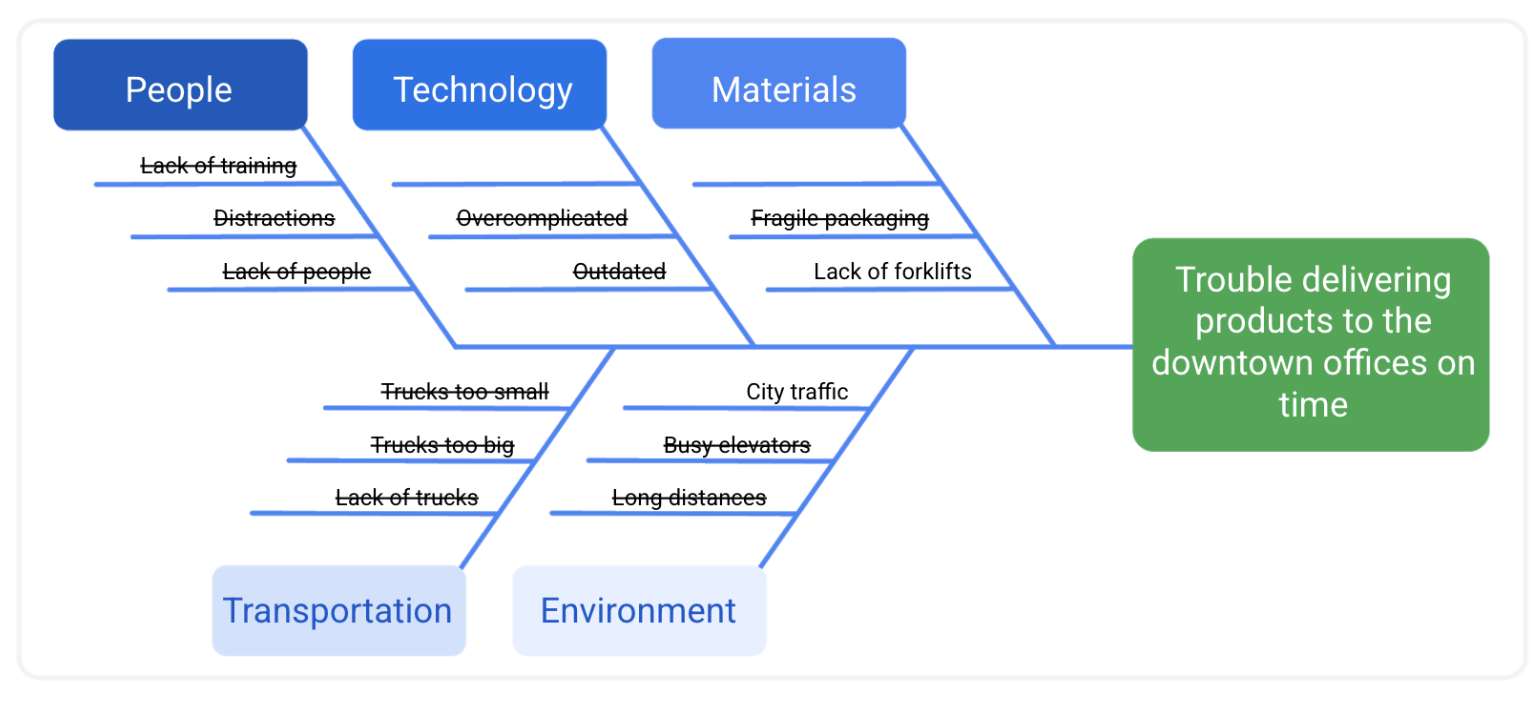
Analyze the causes
Now that Miguel has discovered several possible causes for the delivery problems to downtown offices, he analyzes those causes. He needs to identify the root cause of the existing problem so he can figure out how to mitigate it for the current project.
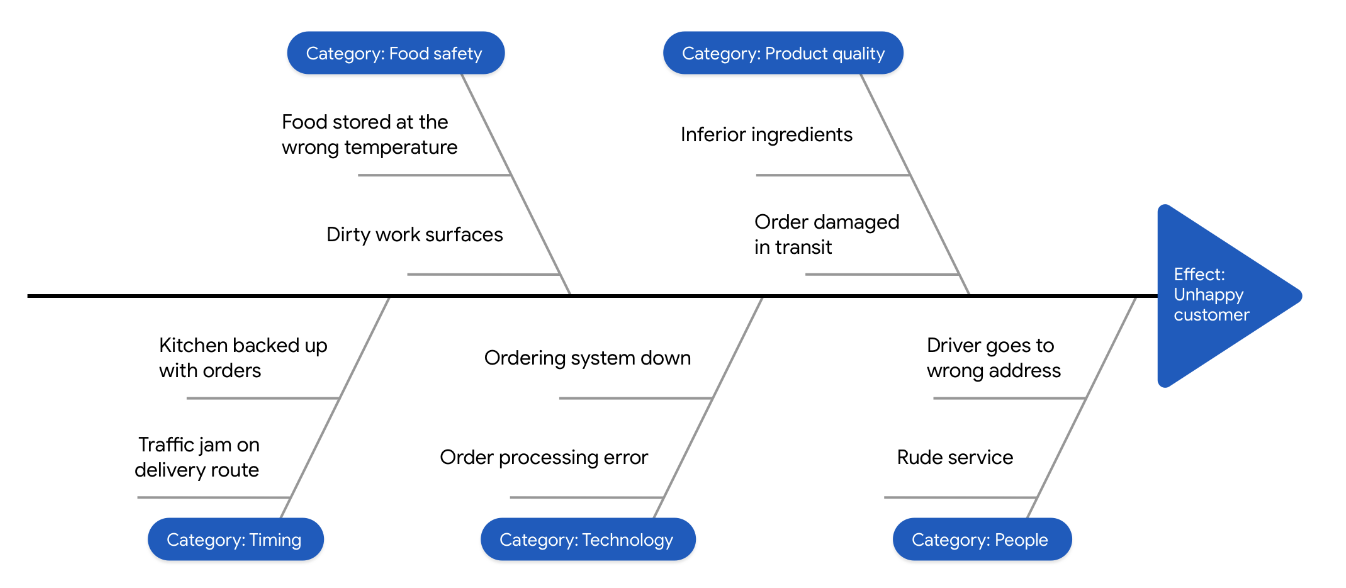
Example
Cloche is a bakery that serves bread, pastries, and light meals. They’re introducing a new delivery service and want to anticipate potential risks.
Types of risks
Time risk: The possibility that project tasks will take longer than anticipated to complete.
Budget risk: The possibility that the cost of a project will increase due to poor planning or expanding the project scope.
Scope risk: The possibility that a project won’t produce the results outlined in the project goals.
External risk: Risks that result from factors outside of the company that you have little to no control over.
Single point of failure risk: A risk that has the potential to be catastrophic and halt work across a project 😈.
- The risk that has the power to stop an entire team in its tracks, meaning that no one can make progress on their tasks until the issue is resolved.
- Example: a power outage that takes down the internal database where every piece of information about the project is stored. Until the database is back up and running, your team won’t have access to any of the information they need to do their jobs. As a result, your team won’t be able to complete any of their assigned tasks.
- Mitigation strategies
Avoid: seeks to sidestep—or avoid—the situation as a whole.
Minimize: trying to minimize the catastrophic effects that it could have on the project.
- Starts with realizing that the risk exists (“Workaround”)
Transfer: shifts the responsibility of handling the risk to someone else
Accept: accept the risk as the normal cost of doing busines
- Active acceptance of risk: setting aside extra funds to pay your way out of trouble
- Passive acceptance of risk: “do nothing” approach (NOT recommended!)
Dependency: A relationship between two project tasks, where the start or completion of one depends on the start or completion of the other.
- Because dependencies are the links that connect one project task to another, they are often a huge source of risk to a project. If you don’t plan for dependencies, you might risk and impact your budget schedule or project outcome!
- Types
- Internal: Dependencies within the project that you and your team have control over.
- External: Dependencies that you have no control over.
Visualizing dependency relationships
Dependencies are a relationship between two project tasks in which the completion or the initiation of one is reliant on the completion or initiation of the other.
Type of dependencies
Finish to Start (FS)
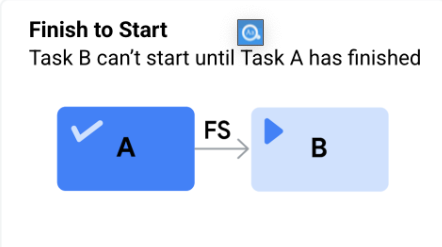
Task A must be completed before Task B can start.
The most common dependency in project management. It follows the natural progression from one task to another.
Example:
You can’t start putting on your shoes (Task B) until you’ve finished putting on your socks (Task A).
Task A: Finish putting on your socks. →Task B: Start putting on your shoes.
Finish to Finish (FF)
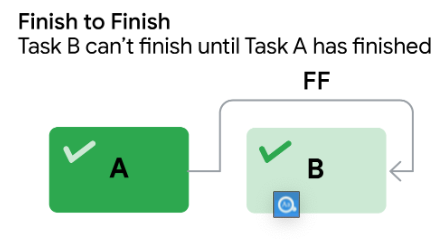
Task A must finish before Task B can finish. (This type of dependency is not common.)
- Task B may start before Task A finishes, but it cannot reach completion until Task A is done.
Example: Earlier in the day, you baked a cake. You can’t finish decorating the cake (Task B) until you finish making the icing (Task A).
Task A: Finish making the icing. →Task B: Finish decorating the cake.
Start to Start (SS)
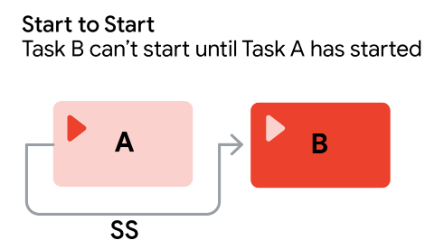
Task B can’t begin until Task A begins. This means Tasks A and B start at the same time and run in parallel.
Example: You need to take the train home after work. You can’t get on the train (Task B) until you pay for the train ride (Task A).
Task A: Start by paying for your train ride. →Task B: Start going home by boarding the train.
Start to Finish (SF)
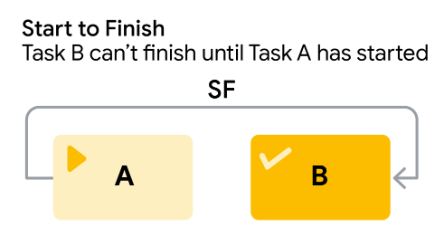
Task A must begin before Task B can be completed.
Example: One of your friends calls to tell you he’ll be late. He can’t finish his shift (Task B) and leave work until his coworker arrives to start her shift (Task A).
Task A: Your friend’s coworker starts her shift. →Task B: Your friend finishes his shift.
Dependency graphs
Example
Imagine you are making peanut butter and jelly sandwiches for the kids who will be coming to your dinner, and you want to use dependency relationships to map your activities on a graph.
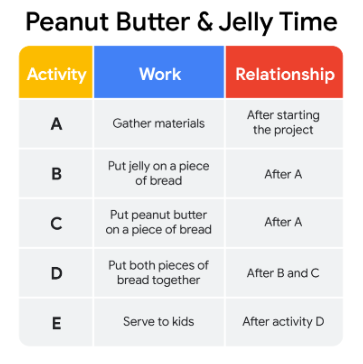
Break each task down to create your dependency graph:
- When you start your sandwiches, you need to gather your materials: bread, knife, jelly, peanut butter, plates, and napkins (Task A).
- At this point, you can put jelly on one piece of bread (Task B) and peanut butter on the other piece of bread (Task C).
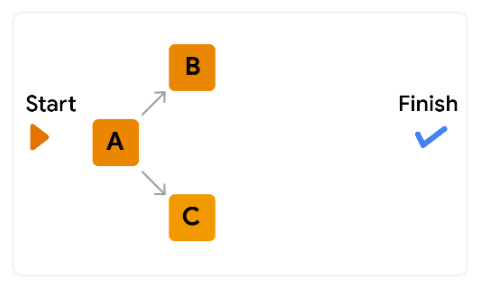
Now you need to put both pieces of bread together (Task D).
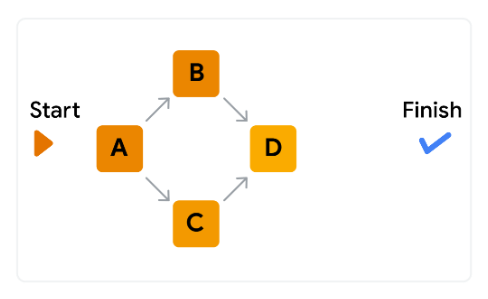
Finally, you can put the sandwich on a plate and serve it (Task E).
Mitigating and Communicating Risks
Risk mitigation strategies
Avoid
Accept
Reduce or control
Determine potential options to address it.
Decision tree: A flowchat that helps visualize the wider impact of a decision on the rest of a project.
Transfer
Building a risk management plan
Risk management plan: A living document that contains information regarding high-level risks and the mitigation plan for each of those risks.
- Helps ensure that teammates and stakeholders have a clear understanding of potential problems and a plan to address them should they occur.
- Should be updated regularly to add newly-identified risks, remove risks that are no longer relevant, and include any changes in the mitigation plans.
Communicating risk to stakeholders
Why should you as a project manager communicate risks to project stakeholders?
- If you don’t tell your stakeholders about important risks, they may be less equipped to help you if an issue does arise.
- Failing to communicate risks to stakeholders can erode thier trust in you as the leader of the project!
Communicate early and often with stakeholders about medium- and high-level risks.
How to communicate risks to stakeholders during the planning phase?
- Depends on the severity of the risk.
Severity Communication Low Email Medium Direct e-mail between yourself and the stakeholder in which you outline the risk with more specifics and provide a detailed explanation of your plan to mitigate the risk. High A thorough and direct level of communication